Best 56 Interactive Chart Creation Tools Tools in 2026
Discover the best AI interactive chart creation tools tools including Interactive Chart Creation Tools, AI Conversation Analysis Tools, Form Building and Data Collection Tools, and more. Compare free and paid options to find your perfect solution.
Discover top-rated Interactive Chart Creation Tools tools and free Interactive Chart Creation Tools solutions. Compare features, pricing, and user reviews to find the best AI tool for your needs. The best ai tools for Interactive Chart Creation Tools are: Spreadsiteai, Ichartcool, Basquio, App, Kvery, Buildagon, Oclipia, Proofpanel, Dashira, Mobserai

ChartCool is an AI-powered chart generator that allows you to create polished visualizations by simply uploading data and describing your needs in natural language.

Basquio is the AI tool that transforms your CSV, Excel, or spreadsheet data into a polished analysis deck complete with charts and a narrative report, ready for presentation in just 15 minutes.
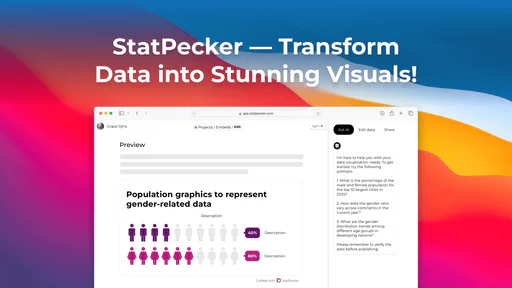
StatPecker provides instant insights and data visualization for effective storytelling.

Kvery enables users to transform SQL queries into dynamic applications effortlessly.


What is AI Interactive Chart Creation Tools
AI Interactive Chart Creation Tools are advanced software solutions that leverage artificial intelligence to assist users in designing and generating interactive charts easily. They often provide capabilities like automated data visualization, user-friendly interfaces, and support for complex datasets, enabling users to create insightful visual representations without extensive technical skills.
Interactive Chart Creation Tools core features
The core features of Interactive Chart Creation Tools typically include: - User-friendly drag-and-drop interfaces for easy chart development - Various chart types like bar, line, scatter, and pie charts - Real-time data integration and updates - Customization options for designs and color schemes - Interactive elements such as tooltips and zoom features - Collaboration capabilities for team use - Export options for various formats, including images and web-based reports.
Who is suitable to use Interactive Chart Creation Tools
Interactive Chart Creation Tools are suitable for a wide range of users, including data analysts, business intelligence professionals, marketers, and educators. They are beneficial for those who need to visualize complex data patterns without deep technical knowledge. Common scenarios involve creating reports, presenting business insights, or developing educational content that requires clear visual aids.
How does Interactive Chart Creation Tools work?
Interactive Chart Creation Tools work by allowing users to input data through various methods, such as spreadsheets or databases. Once the data is configured, users can select chart types that best represent the information. The tools often provide customizable templates and allow for interactive features like filters and drill-down options, enhancing user engagement and comprehension. The final product can be published or embedded in web pages or presentations for easy sharing.
Advantages of Interactive Chart Creation Tools
The advantages of Interactive Chart Creation Tools include their ability to easily create visually appealing and informative charts, which can enhance data comprehension and storytelling. These tools save time by automating tedious tasks and often require no coding knowledge, making them accessible to a broader audience. However, users may encounter limitations such as dependence on internet connectivity or challenges in integrating with other software systems, which can impact usability depending on the context.
FAQ about Interactive Chart Creation Tools
The cost of using Gemini Canvas for chart creation may vary based on the subscription model and services offered. Generally, there are several pricing tiers which may include free trials or basic plans for casual users and paid plans for teams that require advanced features or greater collaboration capabilities. It is advisable to check their official website for the most updated pricing information and any promotional offers.
Featured*
Gemini
Discover Gemini, Google's versatile AI assistant for writing and planning.
Connect with professionals worldwide on LinkedIn.
Gemini
Gemini is Google’s AI assistant for writing and brainstorming.
Microsoft
Easily create and edit high-quality videos with Clipchamp.
Bbc
Stay updated with reliable news from around the world.
Zoom
Connect and collaborate seamlessly with Zoom's all-in-one platform.
Apple
Apple Creator Studio offers a suite of creative tools for video, music, and design.
Adobe
Adobe empowers users to create and optimize digital content.
Deepseek
DeepSeek focuses on pioneering general AI technologies and models.
Deepseek V4
Explore cutting-edge AI models with Deepseek.