

Flourish


What is Flourish?
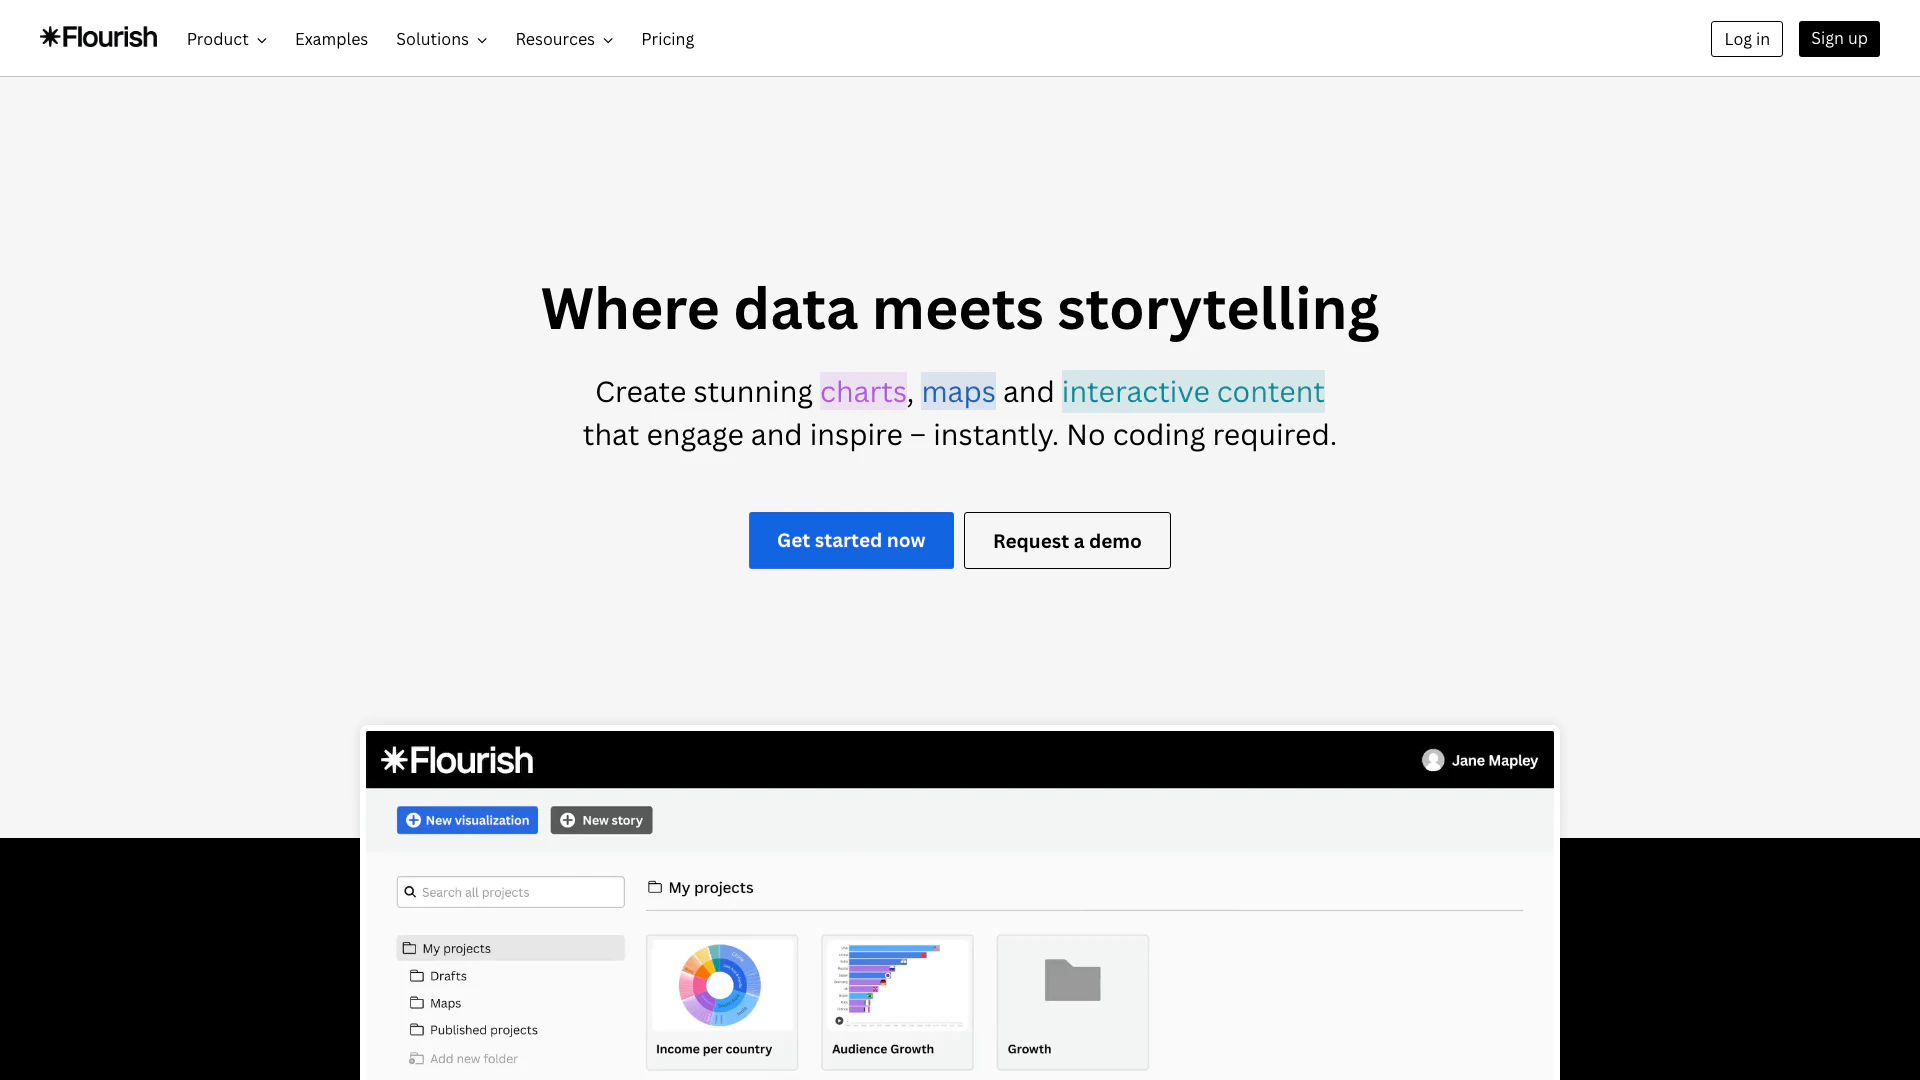
Flourish is a powerful data visualization[1] platform that empowers users to bring data to life through engaging and interactive content[2]. Designed for creators of all skill levels, Flourish enables users to create stunning visualizations without any coding required. With a rich library of templates, users can easily transform complex data into compelling stories, making it an ideal tool for professionals in various fields including journalism, marketing, and education. Flourish is trusted by organizations worldwide for its ability to create immersive data narratives that captivate audiences.
How to use Flourish?
- Sign up or log in to your Flourish account at the official website.
- Choose a template from the extensive library that fits your data visualization needs.
- Import your data into the selected template using the user-friendly interface.
- Customize your visualization by adjusting settings, adding labels, and incorporating interactive elements.
- Preview your visualization to ensure it meets your expectations, then publish or embed it on your website or social media.
What are the main features of Flourish?
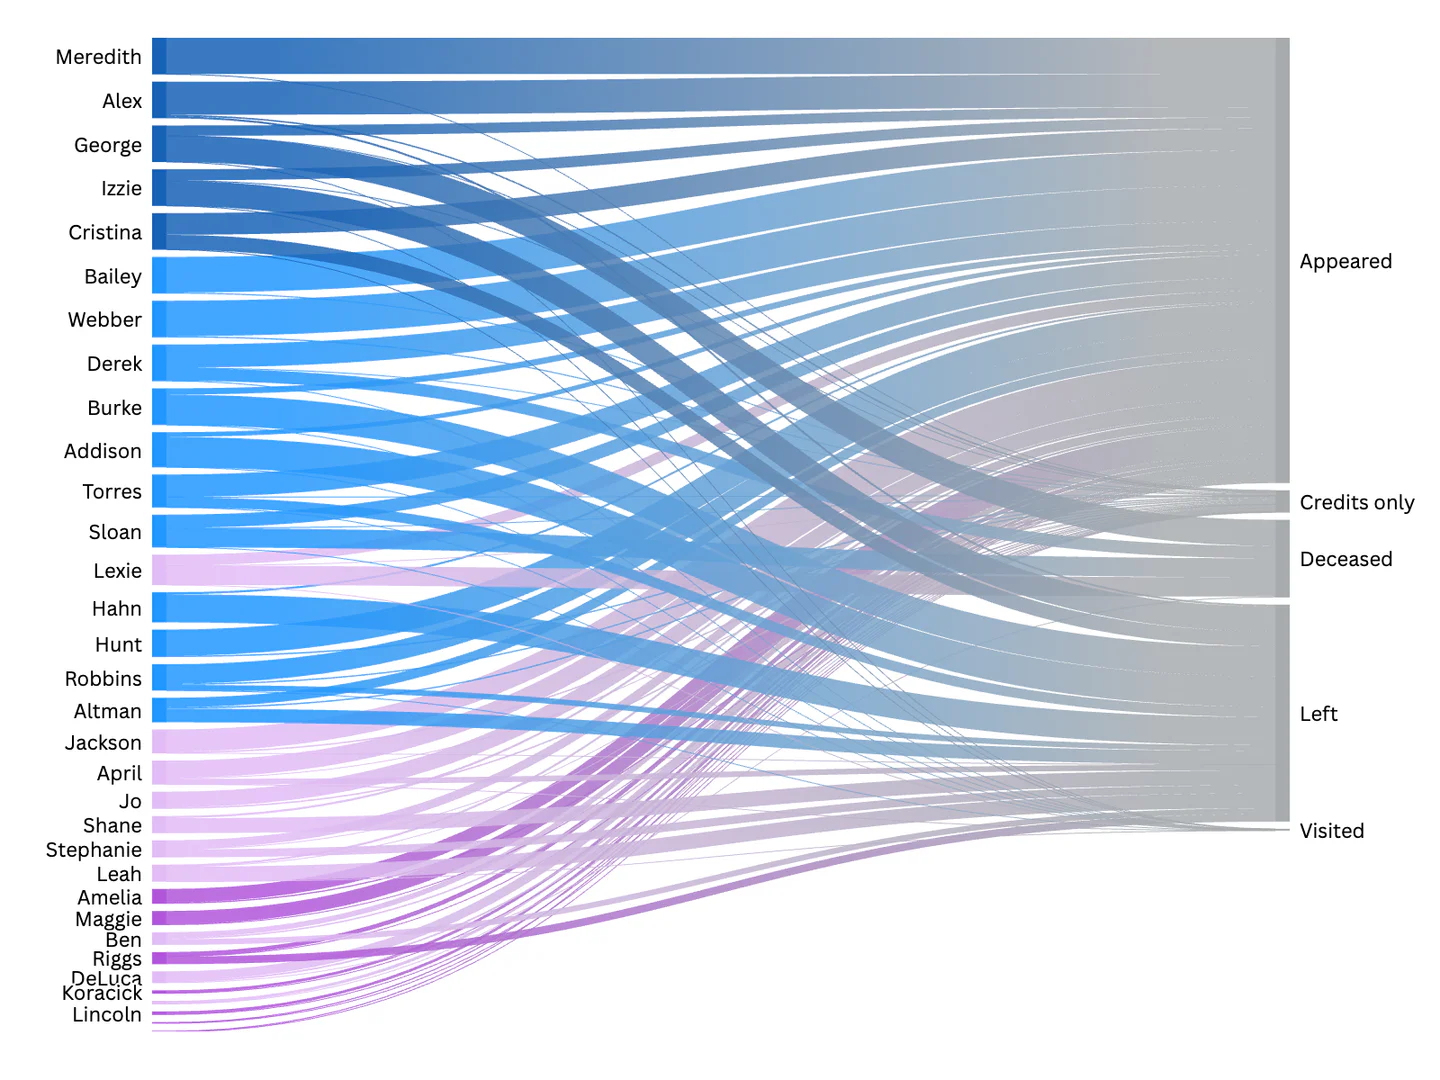
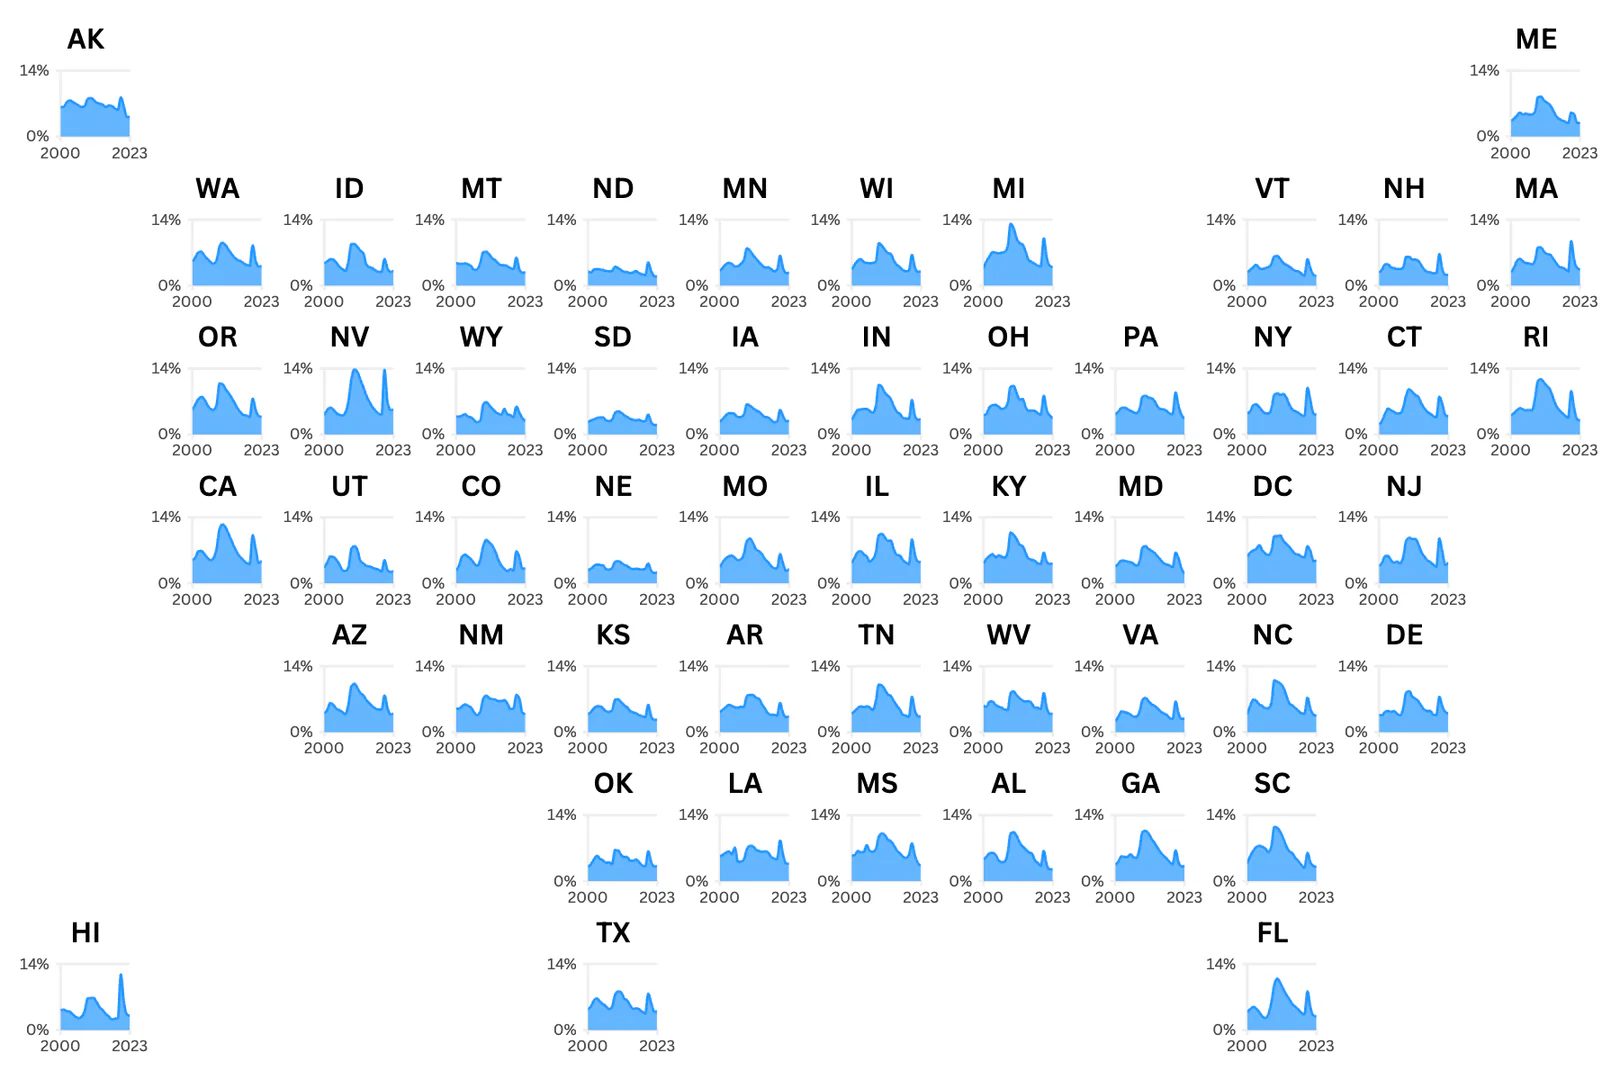
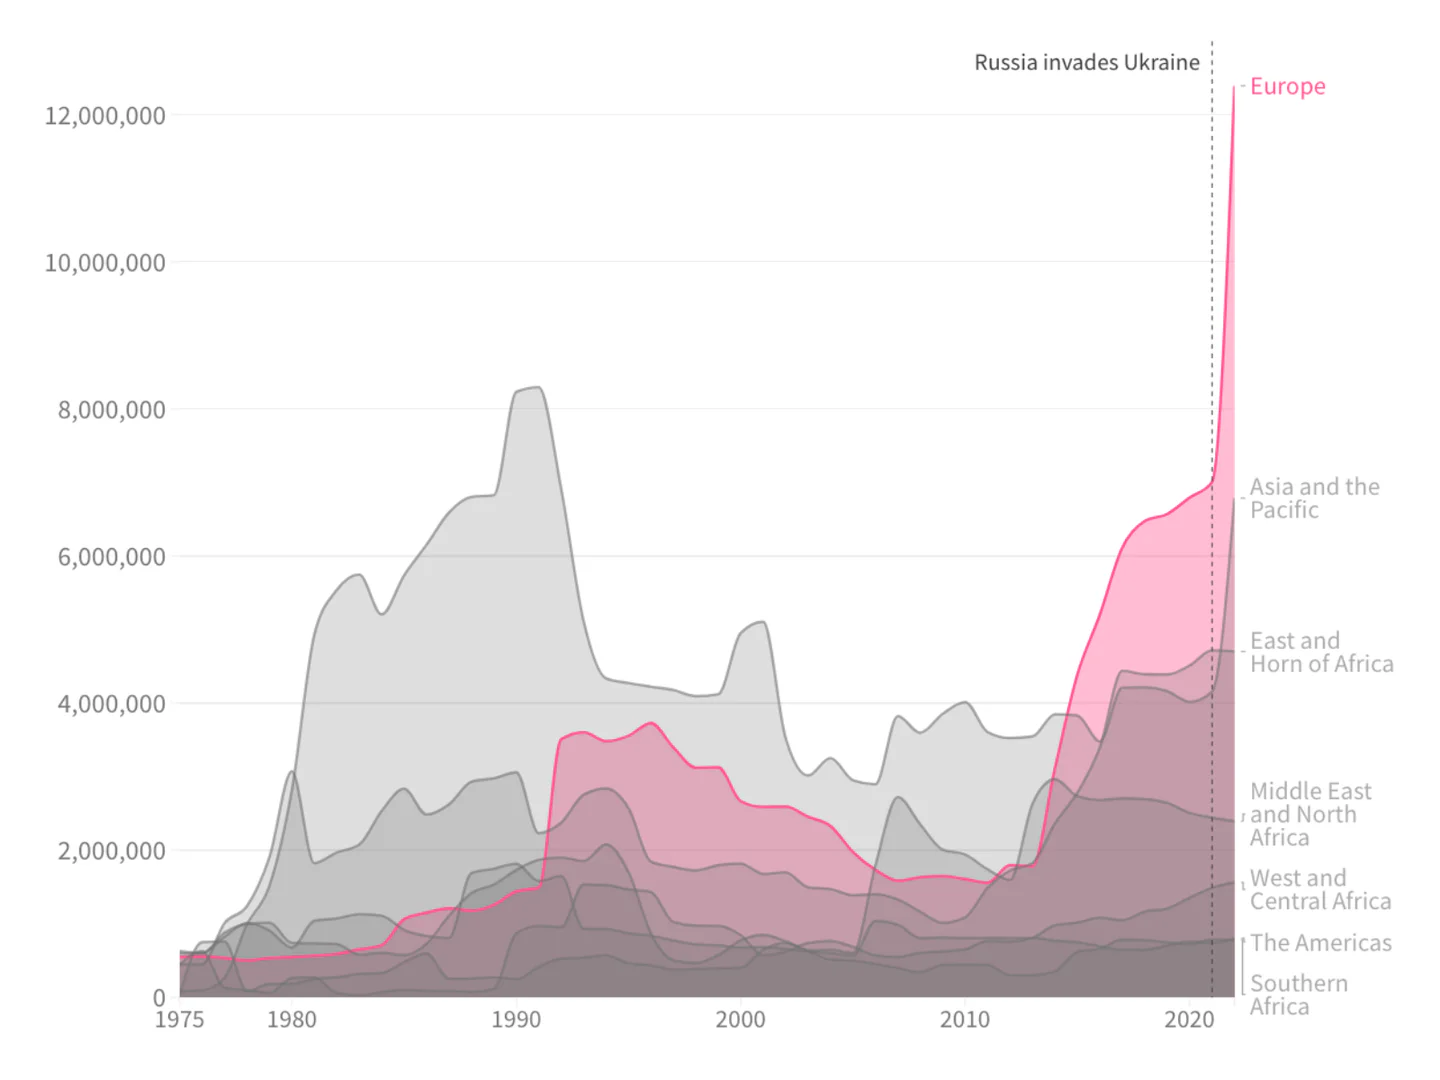
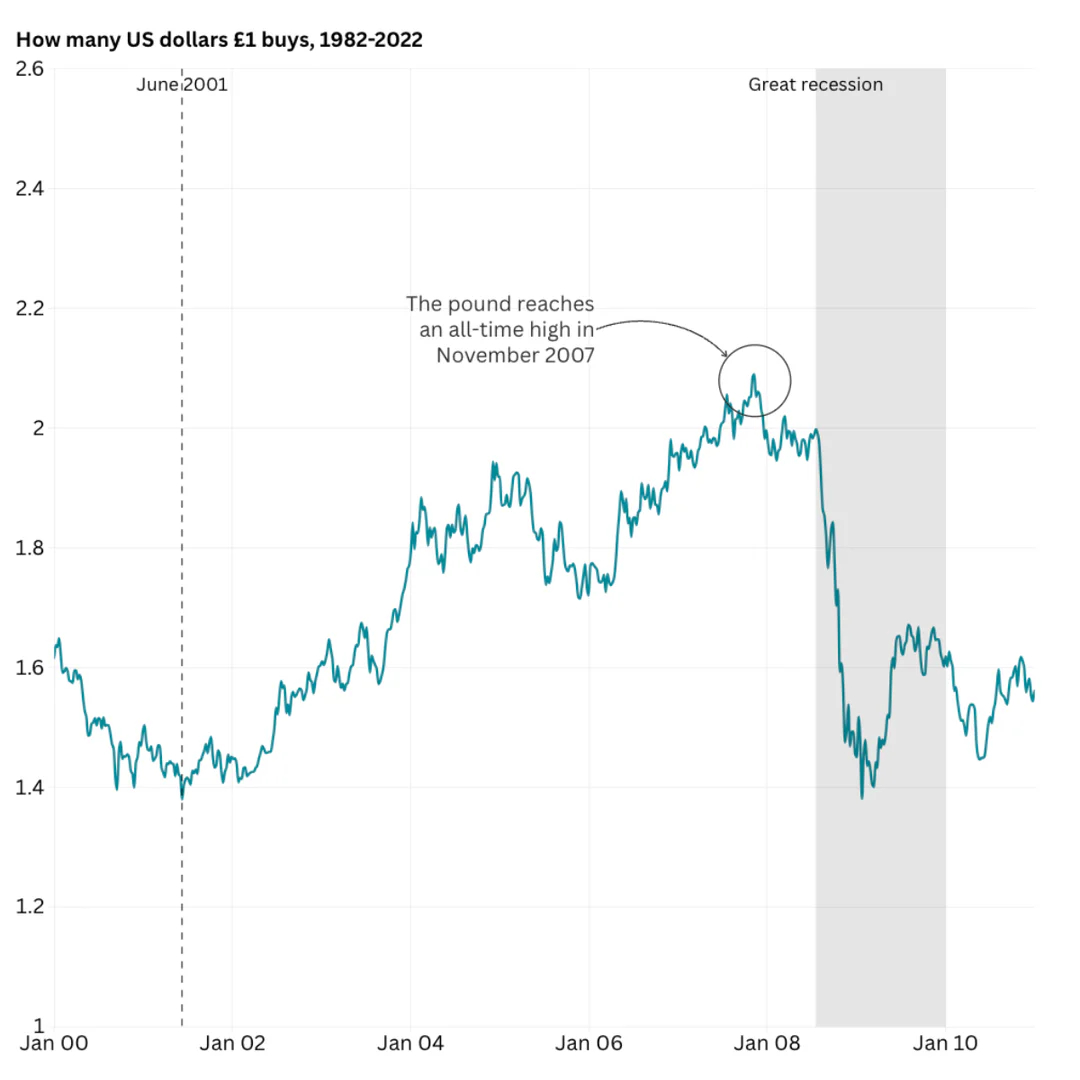
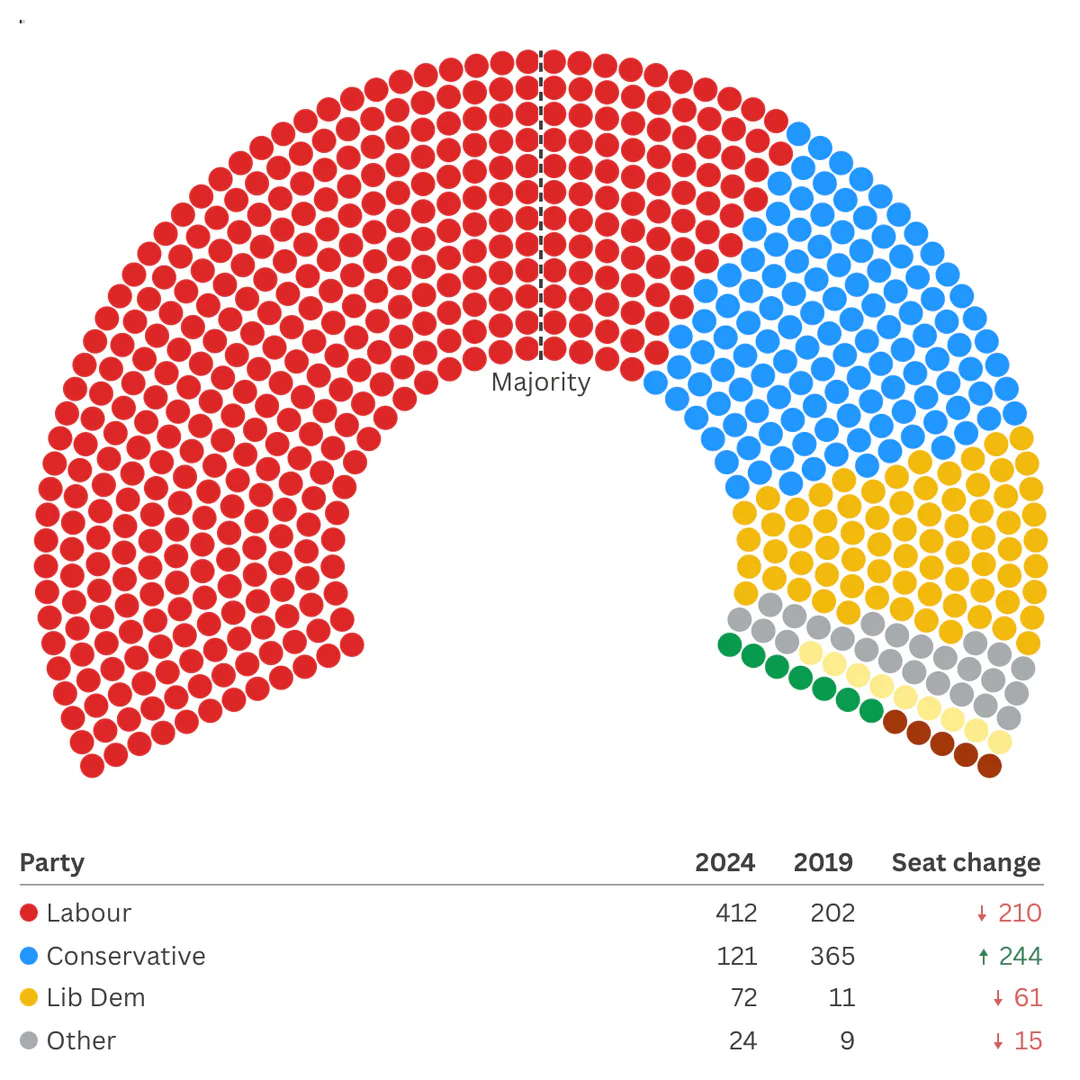
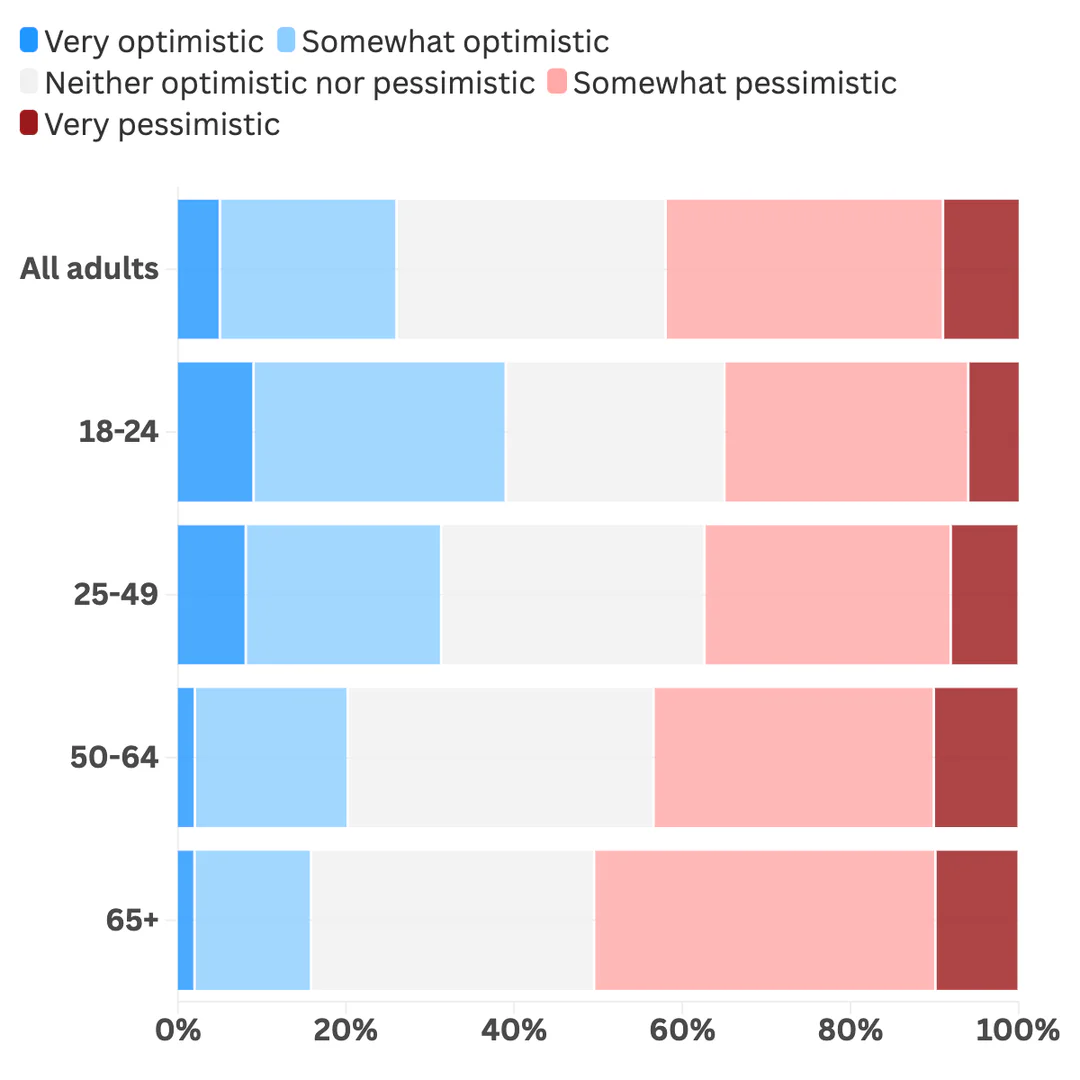
- Interactive Visualizations: Create dynamic charts[5] and maps that engage users and allow them to explore data interactively.
- No-Code Templates[3]: Utilize a wide range of templates designed for various types of data storytelling, eliminating the need for coding skills.
- Scrollytelling[4]: Build multi-step narratives that guide viewers through complex data stories using interactive elements.
- Seamless Sharing: Easily embed visualizations across different platforms, ensuring they look great on any device.
- Collaboration Tools: Work with teams to create branded and polished visualizations through advanced sharing and customization options.
Who is Flourish for?
Flourish is designed for a wide range of users including journalists, marketers, educators, and data analysts. It is particularly beneficial for those who need to present complex data in an understandable and engaging format. Newsrooms utilize Flourish for creating compelling stories through data visualizations, while marketers use it to enhance their campaigns with interactive content. Additionally, educators can leverage Flourish to make learning materials more interactive and engaging for students.
What are the use cases of Flourish?
- Data Journalism: Create interactive visualizations to accompany news articles, enhancing storytelling and reader engagement.
- Marketing Campaigns: Develop eye-catching infographics and interactive content that can be shared across social media platforms to boost audience interaction.
- Educational Presentations: Utilize Flourish to create interactive learning materials that help students visualize complex concepts and data.
Product Images



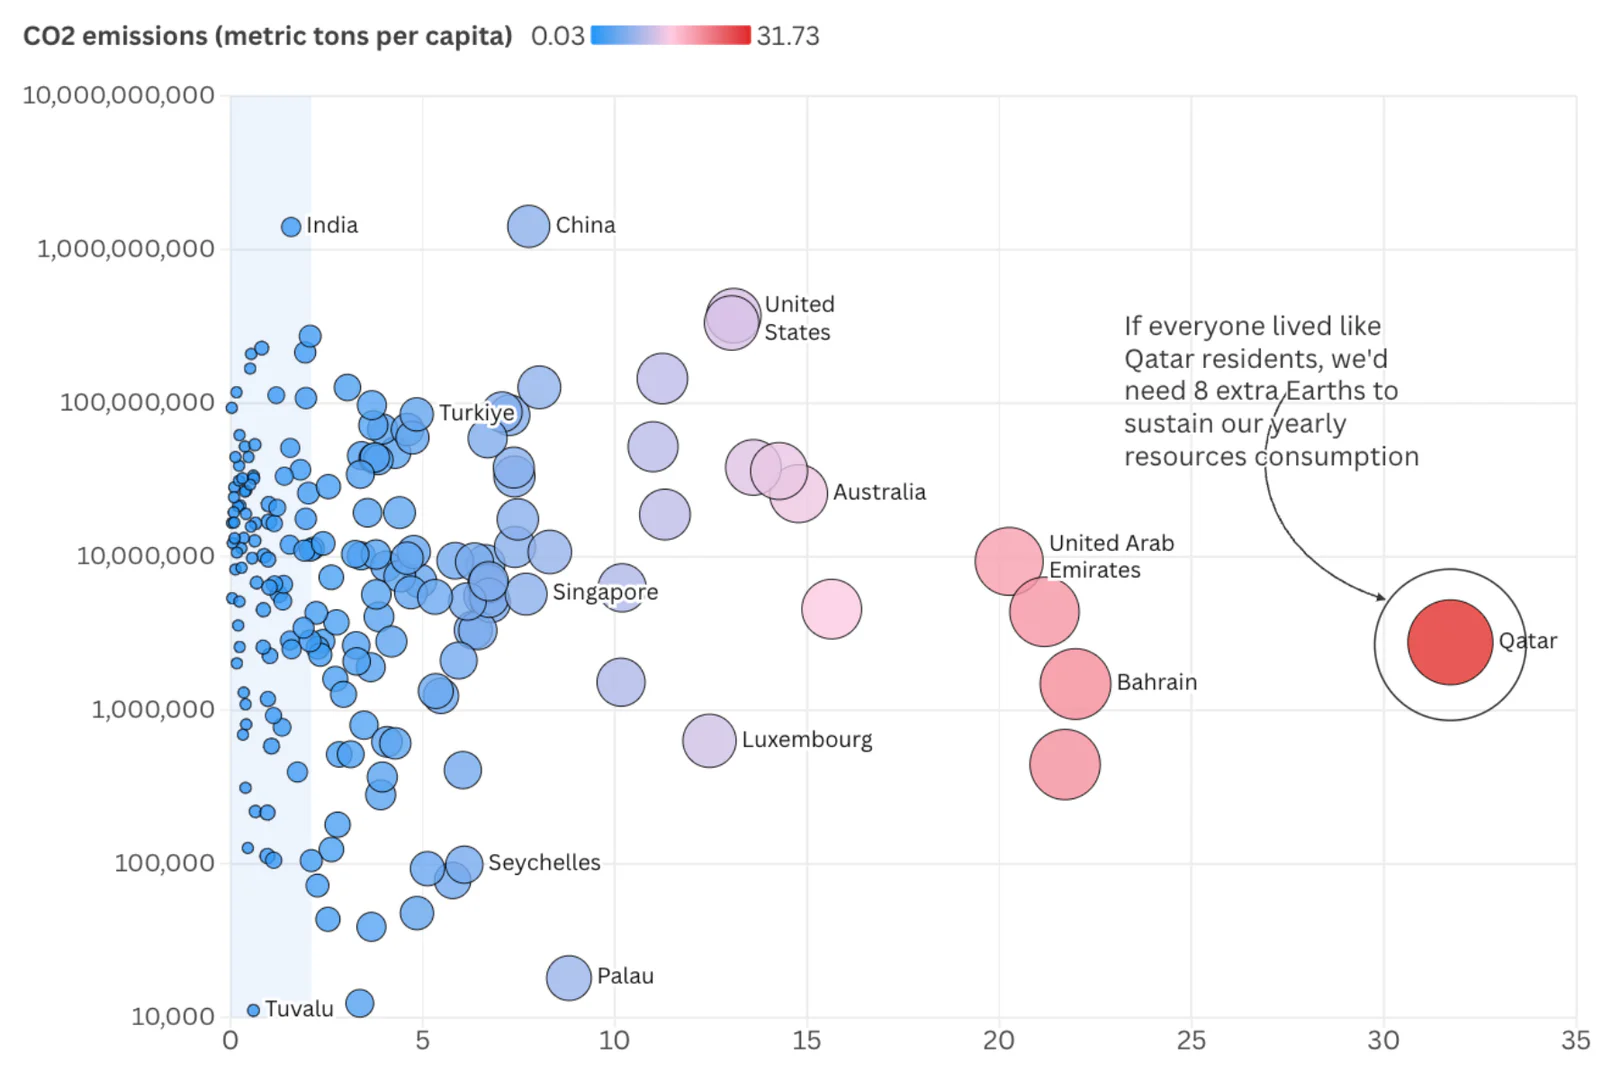
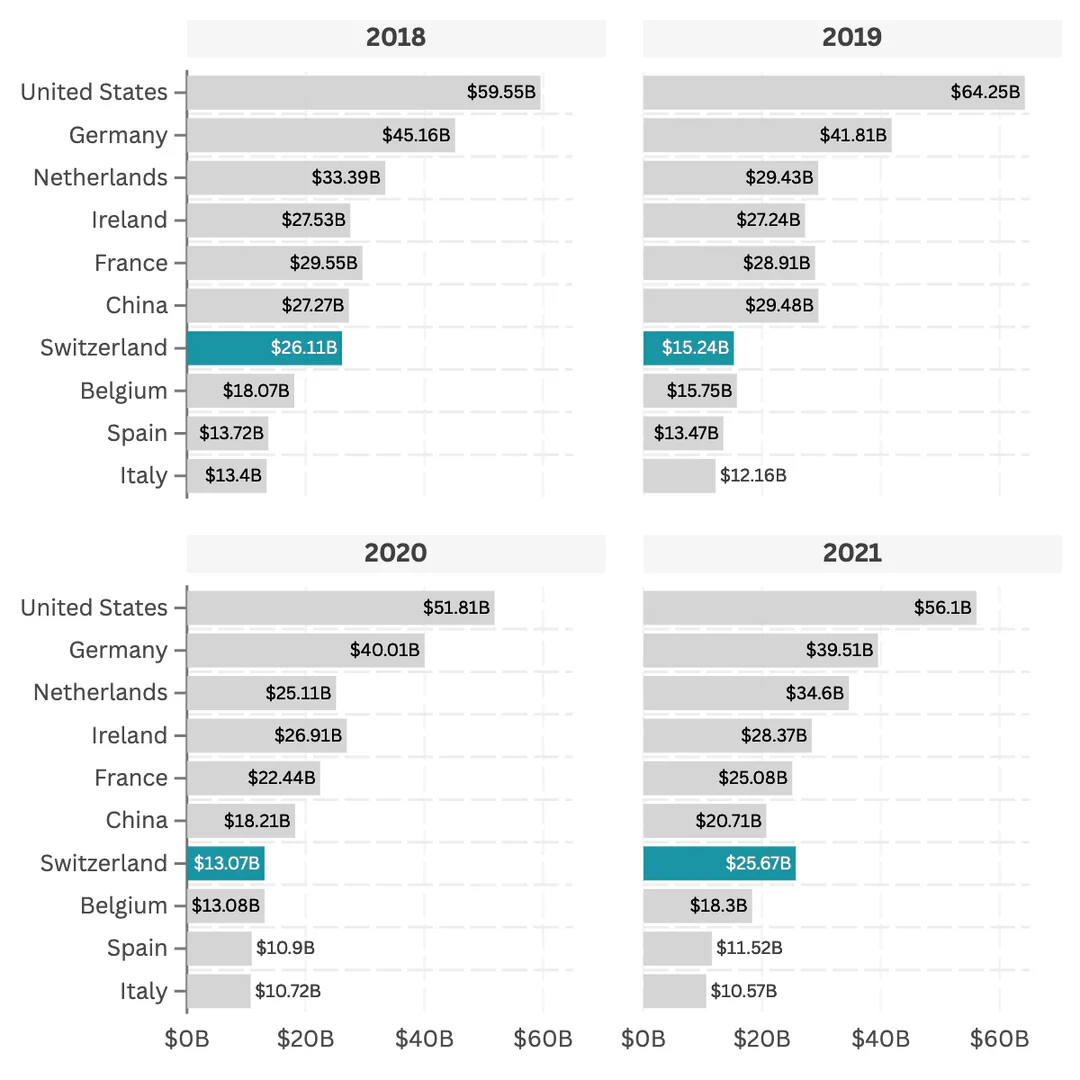
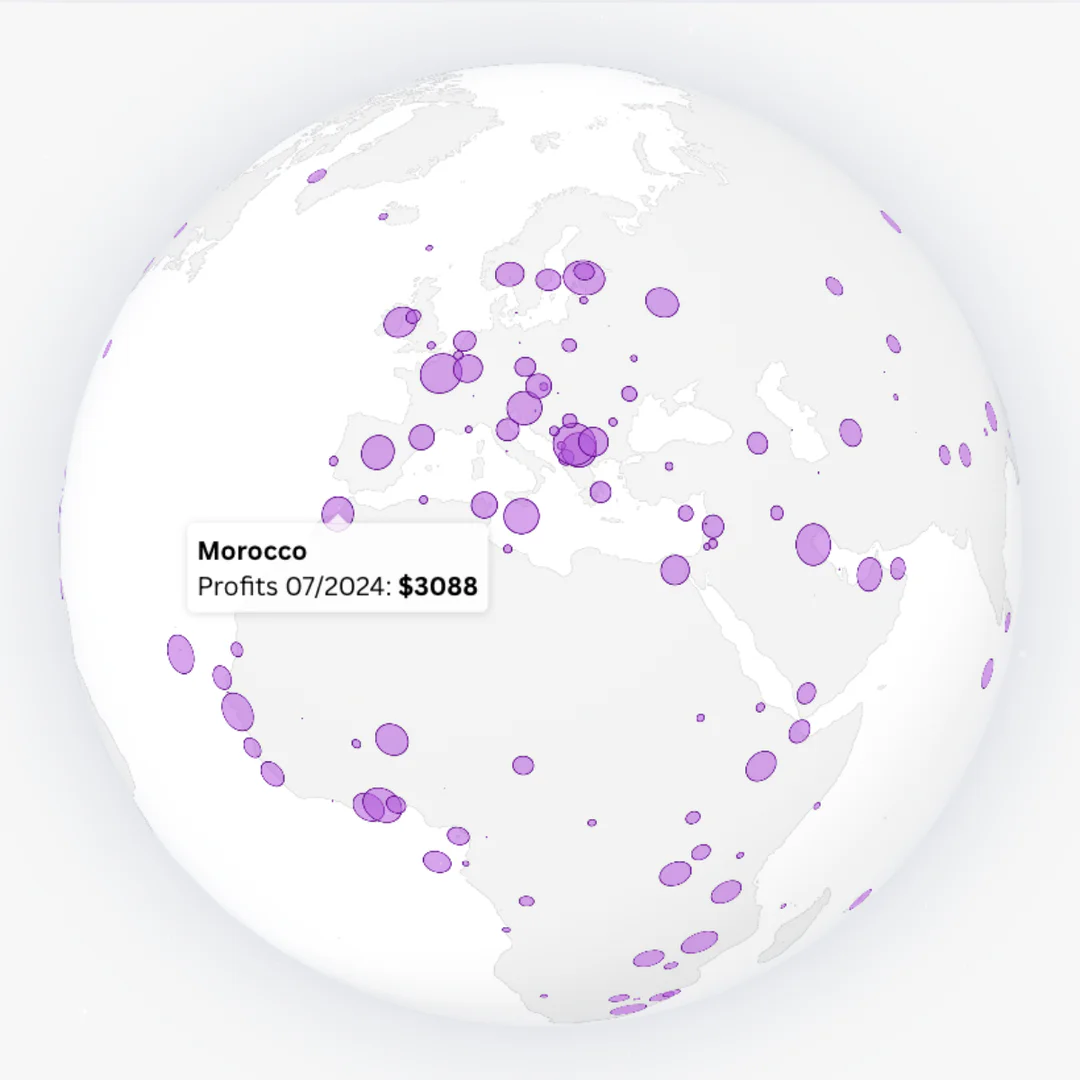
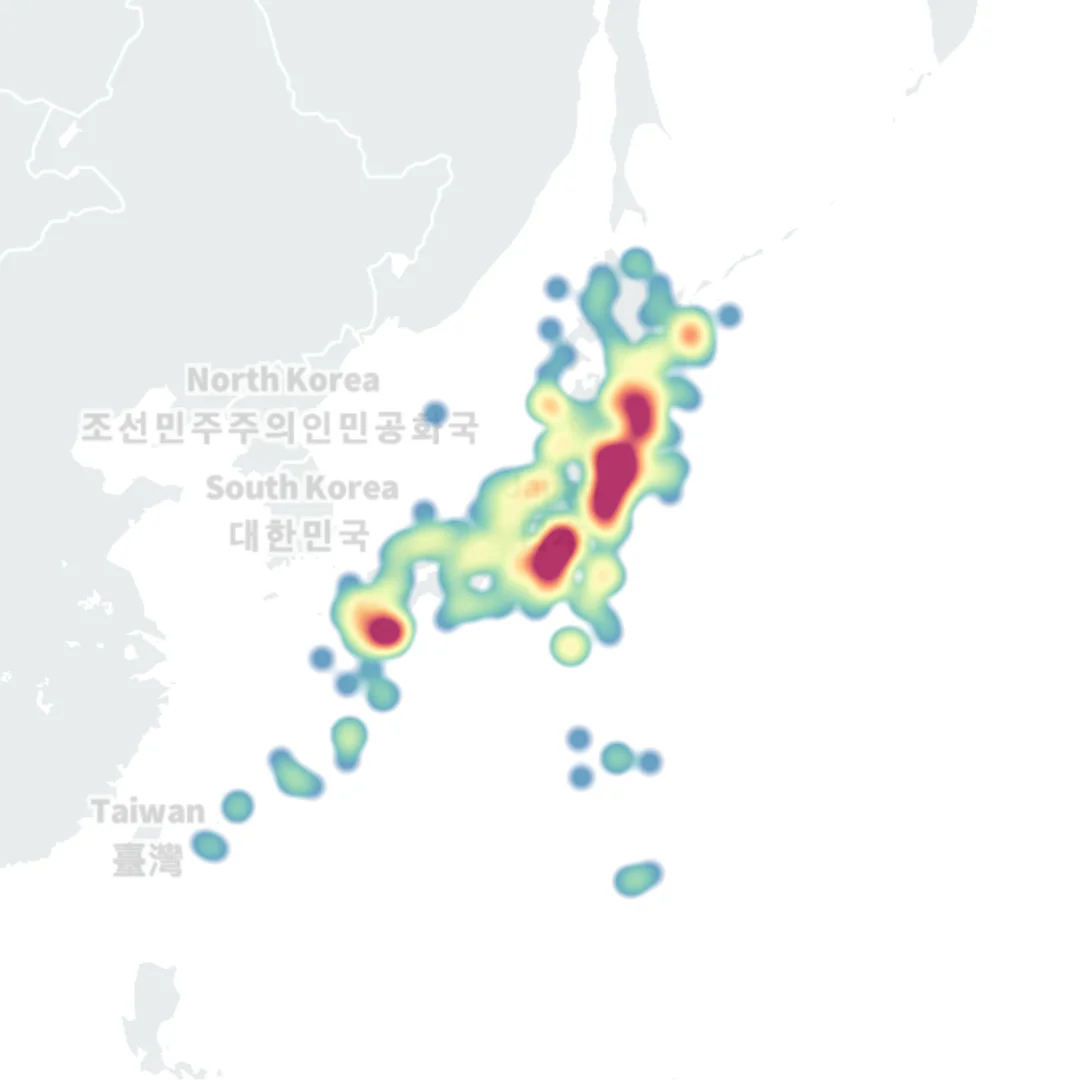

Flourish Pros and Cons
Pros
- No-Code Data Visualization: Flourish allows users to create interactive charts and maps without any coding knowledge, making data visualization accessible to everyone.
- Interactive Storytelling Features: The platform supports multi-step explainers and scrollytelling, enabling users to create engaging narratives with their data.
- Seamless Sharing and Embedding: Flourish visualizations can be easily shared and embedded across various platforms, ensuring they look great on any device.
Cons
No cons data detected for this tool
Flourish Pricing
Enterprise
For enterprise-grade security, control and support. All in Publisher, plus: Advanced security and access controls, SSO and password management policies, custom themes (multiple) with hosted fonts and branding, live rendering API to integrate visualizations into 3rd party systems, dedicated account manager and priority support, SLAs, invoicing, and enterprise compliance.
For the latest pricing, please visit this link: https://flourish.studio/pricing/
Prices are subject to change. Please visit the official website for the most up-to-date pricing information.
Analytics of Flourish
Flourish Website Traffic Analysis
Visits Over Time
Traffic Sources
Oct 2025 - Dec 2025 Worldwide Desktop Only
- Direct: 52.66%
- Search: 34.78%
- Referrals: 8.55%
- Social: 3.23%
- Paid Referrals: 0.69%
- Mail: 0.09%
Top Keywords
| Keyword | Volume | CPC | Estimated Value |
|---|---|---|---|
| flourish | 101.45K | $2.61 | $54410.00 |
| flourish studio | 5.96K | $3.04 | $4100.00 |
| florish | 3.99K | $1.17 | $800.00 |
| flourish presenter | 3.64K | $0.00 | $1780.00 |
| fluorish | 1.65K | $4.27 | $800.00 |
Flourish Reviews
Flourish support is great: accessible, friendly, pursuing solutions for our eternal ‘exception of the rules’ queries to make visualizations work in our 40 languages.
We live and breathe data, and no tool has enabled us to bring our data to life in a beautiful way better than Flourish has. It's a game changer.
For more reviews, visit this link: https://flourish.studio/#reviews


Flourish Social Listening
Seachem Flourish review | Does...
Seachem Flourish is one of the...
FLOURISH TUTORIAL: PART 1 - In...
Flourish is a new data visuali...
Flourish Excel | The Truth
Try Flourish Excel for yoursel...
Unlock to view 51 social media results.