Chartpixel





What is ChartPixel?
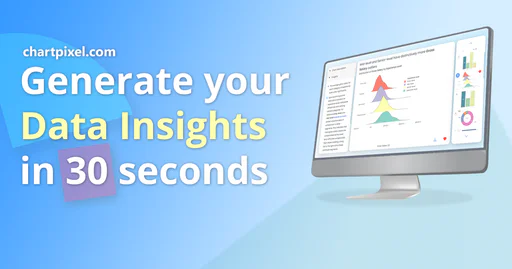
ChartPixel is an innovative AI-driven[1] data analysis[2] tool designed to simplify the process of transforming messy data into insightful visualization[6]s. It enables users to create interactive charts[3] and graphs, offering actionable insights[5] from various data types, including surveys, customer feedback, and business metrics. By utilizing advanced AI algorithms, ChartPixel automates data cleaning[4], analysis, and visualization, making it accessible for users of all skill levels. Its mission is to demystify data, providing a user-friendly platform that empowers individuals and organizations to make informed, data-driven decisions.
How to use ChartPixel?
- Upload Your Data: Begin by dropping or uploading your data files, such as Excel or CSV formats. You can also explore options for reading tables from websites or using keyword searches.
- Automatic Data Cleaning: Once your data is uploaded, ChartPixel automatically tidies up and enhances your dataset, selecting the most insightful columns and chart types without requiring manual input.
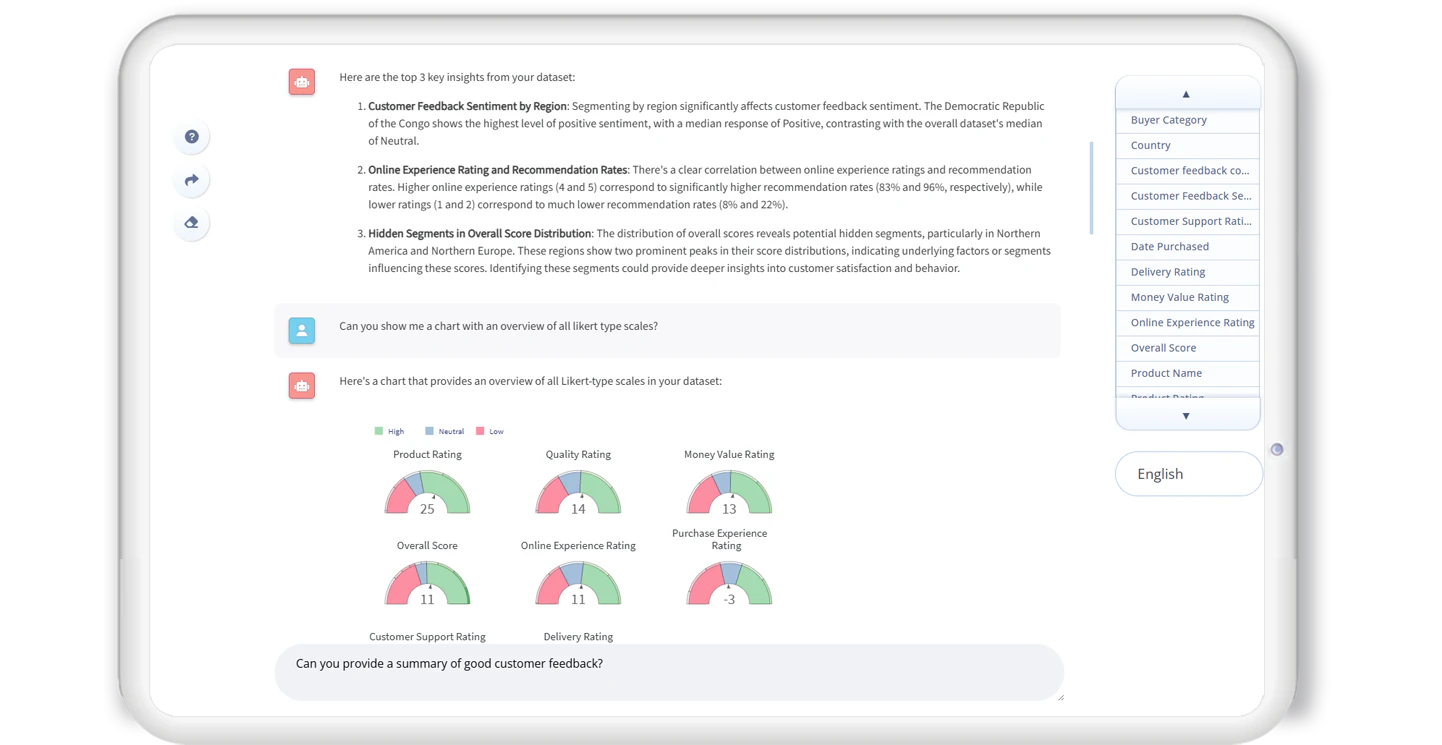
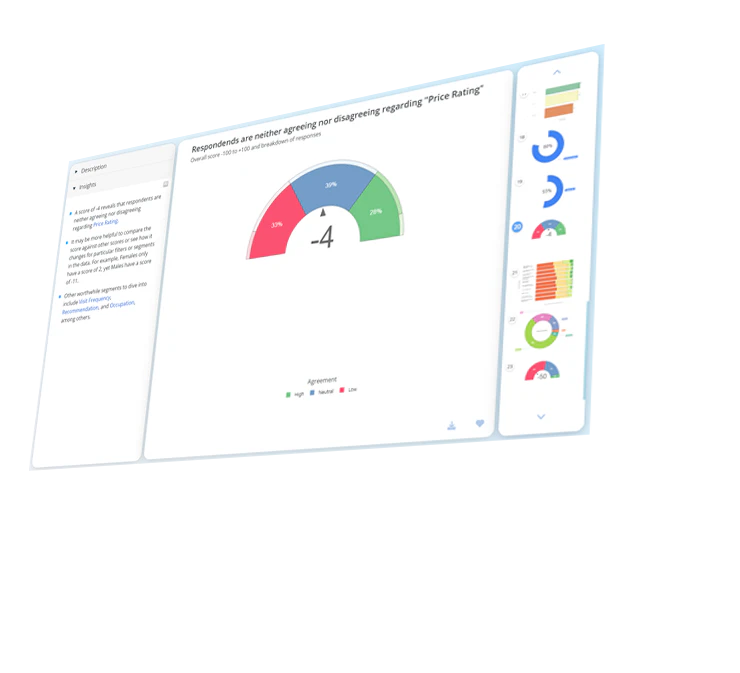
- Generate Insights and Visuals: After the data is processed, ChartPixel generates interactive charts accompanied by AI-assisted written insights. You can further customize these visuals, share them online, or export them directly into PowerPoint for presentations.
What are the main features of ChartPixel?
- AI-Driven Data Analysis: Automates data cleaning, wrangling, and visualization for effortless insights.
- Interactive Charts and Graphs: Create over twenty different chart types with ease, tailored to your data's needs.
- Actionable Insights: Each generated chart comes with detailed explanations and insights to aid decision-making.
- Guided Data Exploration: Offers suggestions on which data columns to select for deeper analysis.
- Fast and User-Friendly: Designed for both beginners and professionals, ensuring a smooth user experience.
Who is ChartPixel for?
ChartPixel is designed for a diverse range of users, including data analysts, researchers, business owners, and students. It caters to those who require quick and reliable data insights without needing extensive technical skills. Professionals in various fields, such as marketing, finance, and academia, can benefit from its ability to streamline data analysis and visualization. Additionally, educators can use ChartPixel as a teaching tool to introduce students to data analysis concepts without the complexities of traditional software.
What are the use cases of ChartPixel?
- Survey Analysis: Quickly analyze customer feedback and satisfaction surveys to uncover trends and insights.
- Business Data Visualization: Transform business metrics into visual reports that facilitate strategic decision-making.
- Research Data Exploration: Support academic research by visualizing complex datasets and extracting meaningful conclusions.
Product Images


Chartpixel Pros and Cons
Pros
- AI-Driven Data Analysis: ChartPixel provides powerful AI-driven data analysis that simplifies complex data sets into actionable insights, making it accessible for users of all skill levels.
- User-Friendly Interface: The platform features an intuitive and user-friendly interface, allowing users to easily create interactive charts and graphs without needing extensive technical knowledge.
- Quick Data Visualization: ChartPixel enables users to instantly visualize messy data through interactive charts, saving time and enhancing decision-making processes.
Cons
No cons data detected for this tool
Analytics of Chartpixel
Chartpixel Website Traffic Analysis
Visits Over Time
Traffic Sources
Nov 2025 - Jan 2026 Worldwide Desktop Only
- Direct: 43.50%
- Search: 40.02%
- Referrals: 8.54%
- Social: 6.40%
- Paid Referrals: 1.25%
- Mail: 0.10%
Top Keywords
| Keyword | Volume | CPC | Estimated Value |
|---|---|---|---|
| chart ai | 4.59K | $1.41 | $20.00 |
| ai chart analysis | 1.44K | $2.13 | $70.00 |
| chart analysis ai | 680 | $0.31 | $70.00 |
| trading chart analysis ai | 320 | $0.00 | $10.00 |
| chart reader ai free | 270 | $0.00 | $10.00 |
Chartpixel Reviews
ChartPixel has immediately saved me time at my job and helps me to present data driven insights. András Borza, Sn. Project Engineer, Mitsuba
Very cool product! It streamlines data visualization, freeing up more of your time for in-depth data analysis. Jeffrey Akiki, Co-Founder, Not Diamond
ChartPixel offers a series of possibilities to speed up the research process with statistical analysis. I've been looking for a tool like this for a long time, and I think it's quite complete. Cristian Sepulveda-Irribarra, Researcher, Research group IEFID
For more reviews, visit this link: https://chartpixel.com#testimonials