Image-charts
What is Image-charts?
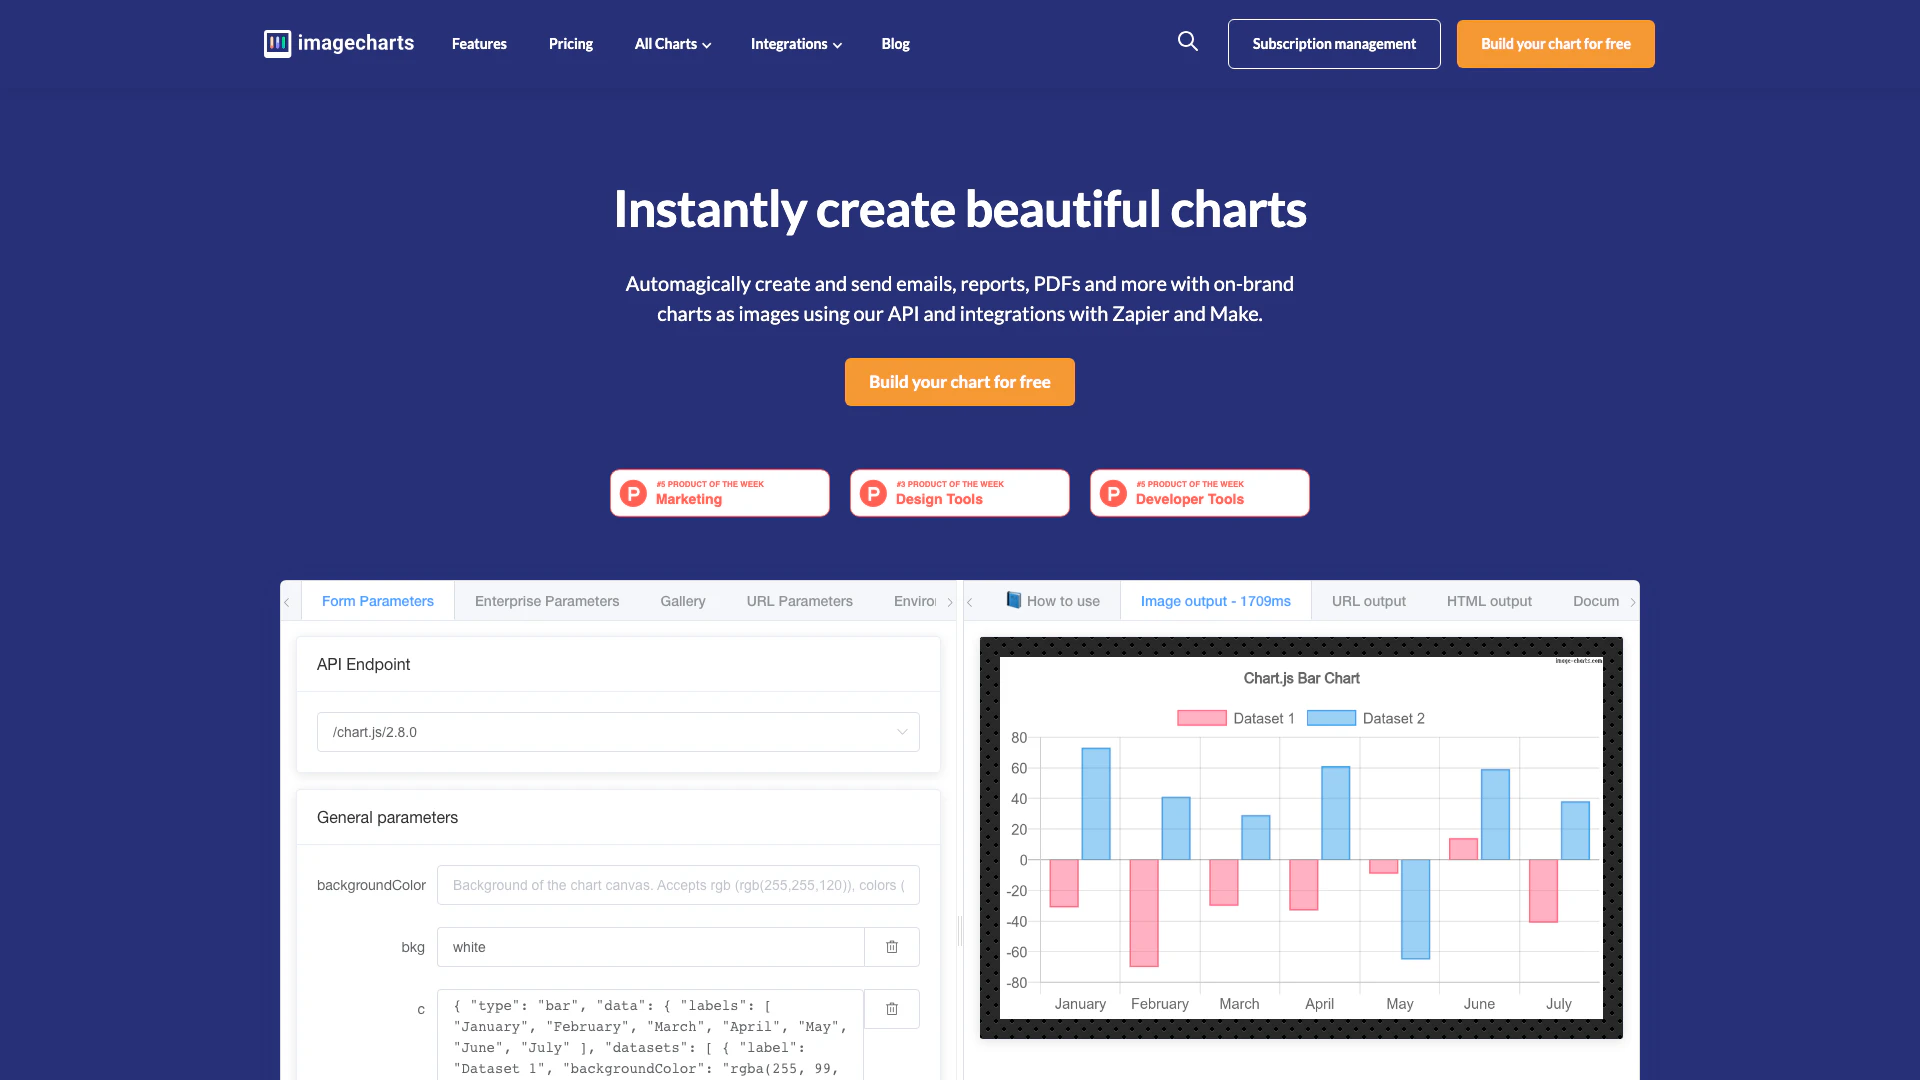
Image-charts is a powerful tool designed to automate the creation and embedding of charts within emails, reports, PDFs, and more. It allows users to generate visually appealing, on-brand charts[5] effortlessly using its API and integrations with platforms like Zapier and Make. Trusted by major companies such as Microsoft, Spotify, and Dropbox, Image-charts simplifies the process of data visualization, making it accessible for both technical and non-technical users.
How to use Image-charts?
- Visit the Image-charts website and sign up for an account.
- Choose a chart template or create a custom chart using the chart editor.
- Integrate Image-charts with your desired platform (like Google Sheets or Zapier) to automate data input.
- Generate your chart and copy the embed code or image URL.
- Embed the chart into your emails, reports, or any other documents as needed.
What are the main features of Image-charts?
- Automated Chart Generation[1]: Create and embed charts automatically with data from various sources.
- Custom API[2]: Integrate seamlessly with your applications to generate charts on-the-fly.
- Wide Range of Chart Types[3]: Supports various chart formats including line, bar, pie, and more.
- No-Code Integration[4]: Easily connect with tools like Zapier and Make without coding.
- On-Brand Charts: Customize charts to match your brand's visual identity.
Who is Image-charts for?
Image-charts is ideal for marketers, business owners, and developers looking to enhance their data visualization capabilities. It caters to users who require quick, automated chart solutions for presentations, reports, and marketing materials. Additionally, it serves as a valuable tool for developers wanting to integrate chart generation into their applications without extensive coding.
What are the use cases of Image-charts?
- Email Marketing: Automatically generate charts for marketing emails to visually present data insights.
- Reporting: Create monthly reports with embedded charts that reflect real-time data.
- Data Visualization in Apps: Integrate charts within applications to provide users with dynamic data visualizations.
Product Images
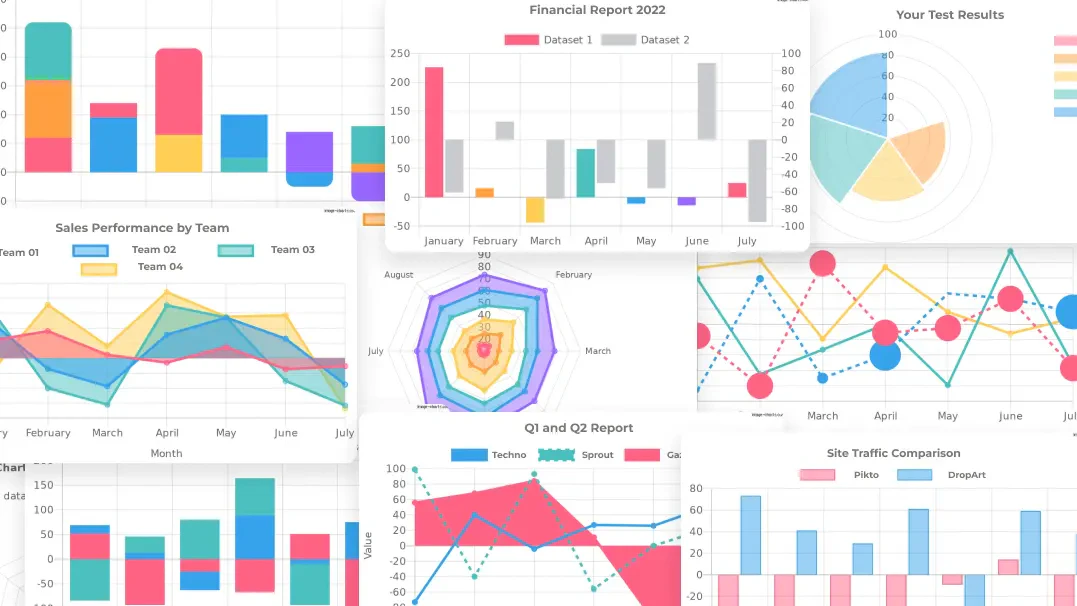
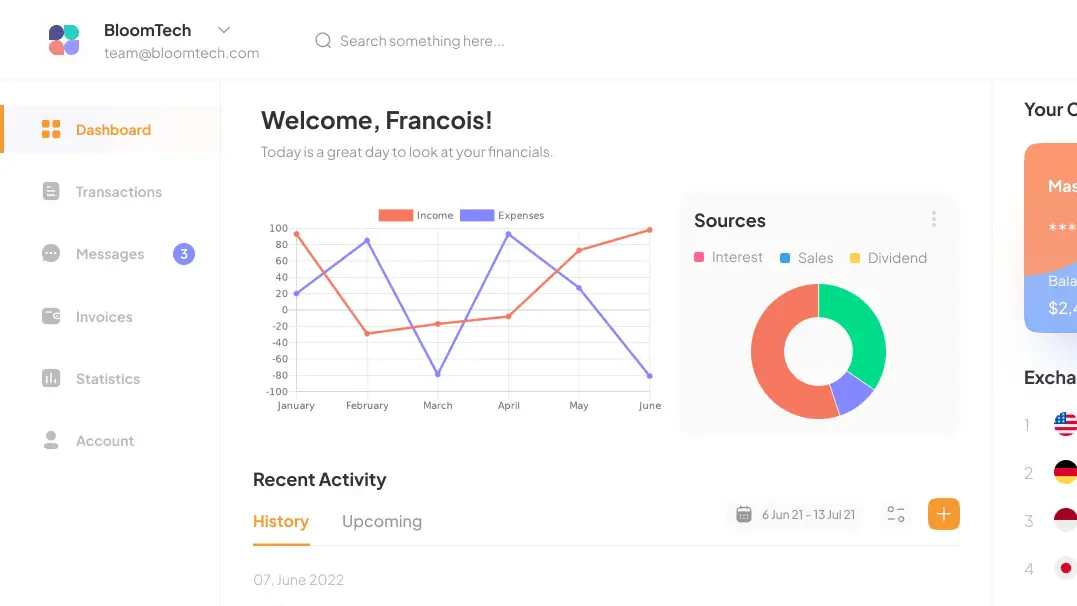
Image-charts Pros and Cons
Pros
- Automated Chart Creation: Image-Charts allows users to automatically create and embed charts in various formats like emails, reports, and PDFs, enhancing productivity.
- Wide Integration Options: The tool integrates seamlessly with popular platforms such as Zapier, Google Drive, and Dropbox, making it easy to incorporate into existing workflows.
- Custom API for Developers: Image-Charts provides a custom API that allows developers to integrate chart generation capabilities into their applications, facilitating a tailored user experience.
Cons
No cons data detected for this tool
Image-charts Pricing
Individual
Get started with dozens of chart templates and manually enter your data to create simple, embeddable charts.
Business
Setup custom workflows with Zapier and Make, and look professional with custom branding. Everything in the Individual plan, plus no watermark, custom subdomain, Zapier and Make integration, priority email support, and priority feature requests.
Enterprise
For power users and professionals building complex and compound charts. Everything in the Business plan, plus dedicated support contact, high-resolution chart support, compound charts, and localization of chart currency symbols.
On-Premise
Customized solutions to your security requirements. Your data never leaves your house. We offer an on-premise virtual machine that keeps your data under your supervision and control.
For the latest pricing, please visit this link: https://www.image-charts.com/pricing
Prices are subject to change. Please visit the official website for the most up-to-date pricing information.
Analytics of Image-charts
Image-charts Website Traffic Analysis
Visits Over Time
Traffic Sources
Nov 2025 - Jan 2026 Worldwide Desktop Only
- Search: 39.98%
- Direct: 39.02%
- Referrals: 9.96%
- Social: 9.58%
- Paid Referrals: 1.05%
- Mail: 0.12%
Top Keywords
| Keyword | Volume | CPC | Estimated Value |
|---|---|---|---|
| graphviz | 29.14K | $2.66 | $30.00 |
| google sheets formula dependencies | 1.03K | $0.00 | $30.00 |
| ichart image | 420 | $0.00 | $140.00 |
| sample line graph with legend | 90 | $0.00 | $80.00 |
| chart analysis image making | 80 | $0.00 | $70.00 |
Image-charts Reviews
I use Image-Charts everyday to integrate charts into marketing emails for my clients. Can't live without it!
Holy crap, @image-charts is phenomenal! I was just about to hire a programmer to integrate charts into my reporting emails. Mind Blown!
Image charts allowed us to quickly replace our internal and old report generation backend and use features we were just dreaming of!
For more reviews, visit this link: https://www.image-charts.com/#testimonials
Image-charts Compare
| Tool Name | Introduction | Pricing | Type | Rating | Launch Date | Learn more |
|---|---|---|---|---|---|---|
Lyrist - Find a beat, beat writer's block | Free | 🎨Creativity | January 29, 2019 | Get deal | ||
Craft a personalized song gift in minutes. | Free | 🙋♂️Personal🎨Creativity | December 27, 2025 | Get deal | ||
Get your workspace roasted by AI! | Free | 🙋♂️Personal💼Work | November 21, 2023 | Get deal |
Info current as of post date. Offers and availability may vary by location and are subject to change.
Image-charts Alternatives
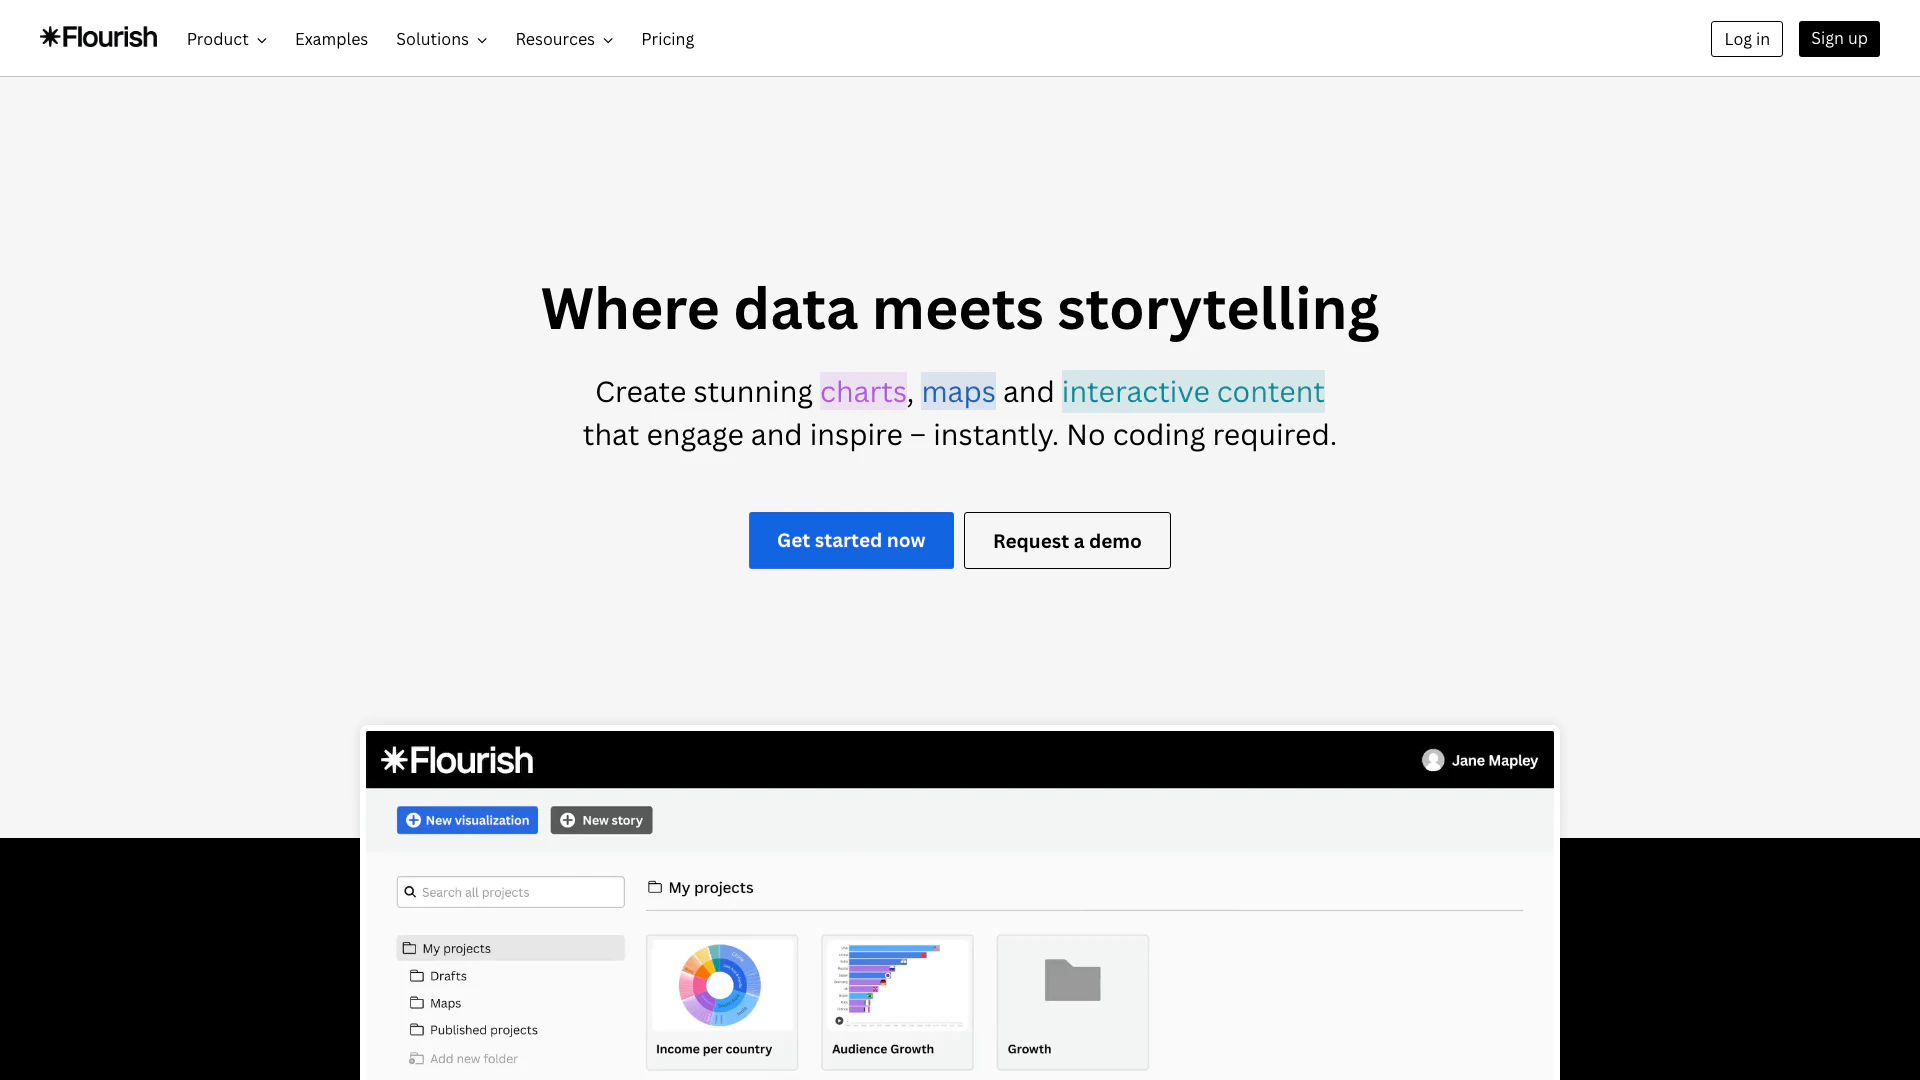
Create stunning interactive data visualizations effortlessly with Flourish.
- Data & Analytics
- AI Data Analytics Tools
- Interactive Chart Creation Tools
- Form Building and Data Collection Tools
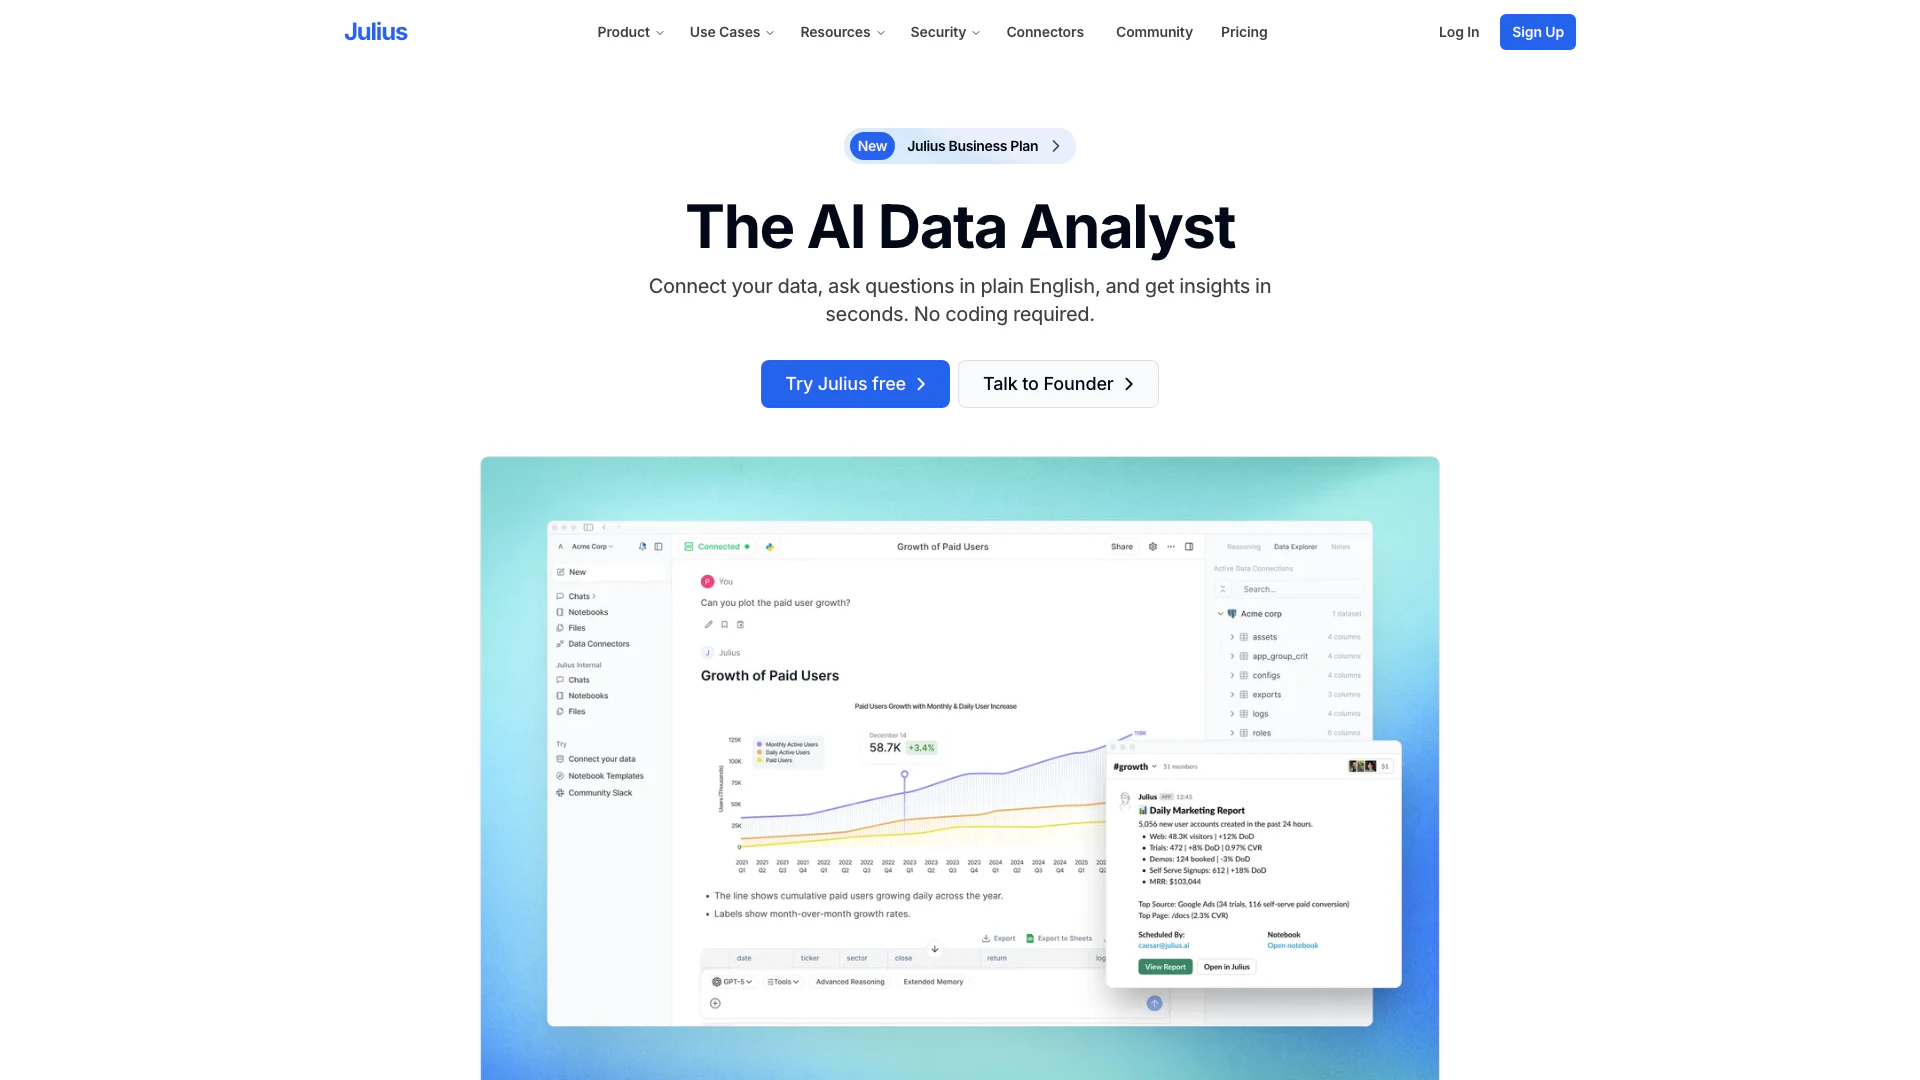
Transform data analysis with Julius AI.
- Data & Analytics
- AI Data Analytics Tools
- AI Prediction Tools
- Interactive Chart Creation Tools

Sisense offers AI-driven analytics to transform data into actionable insights.
- Data & Analytics
- AI Data Analytics Tools
- Interactive Chart Creation Tools