Cleanchart




What is CleanChart?
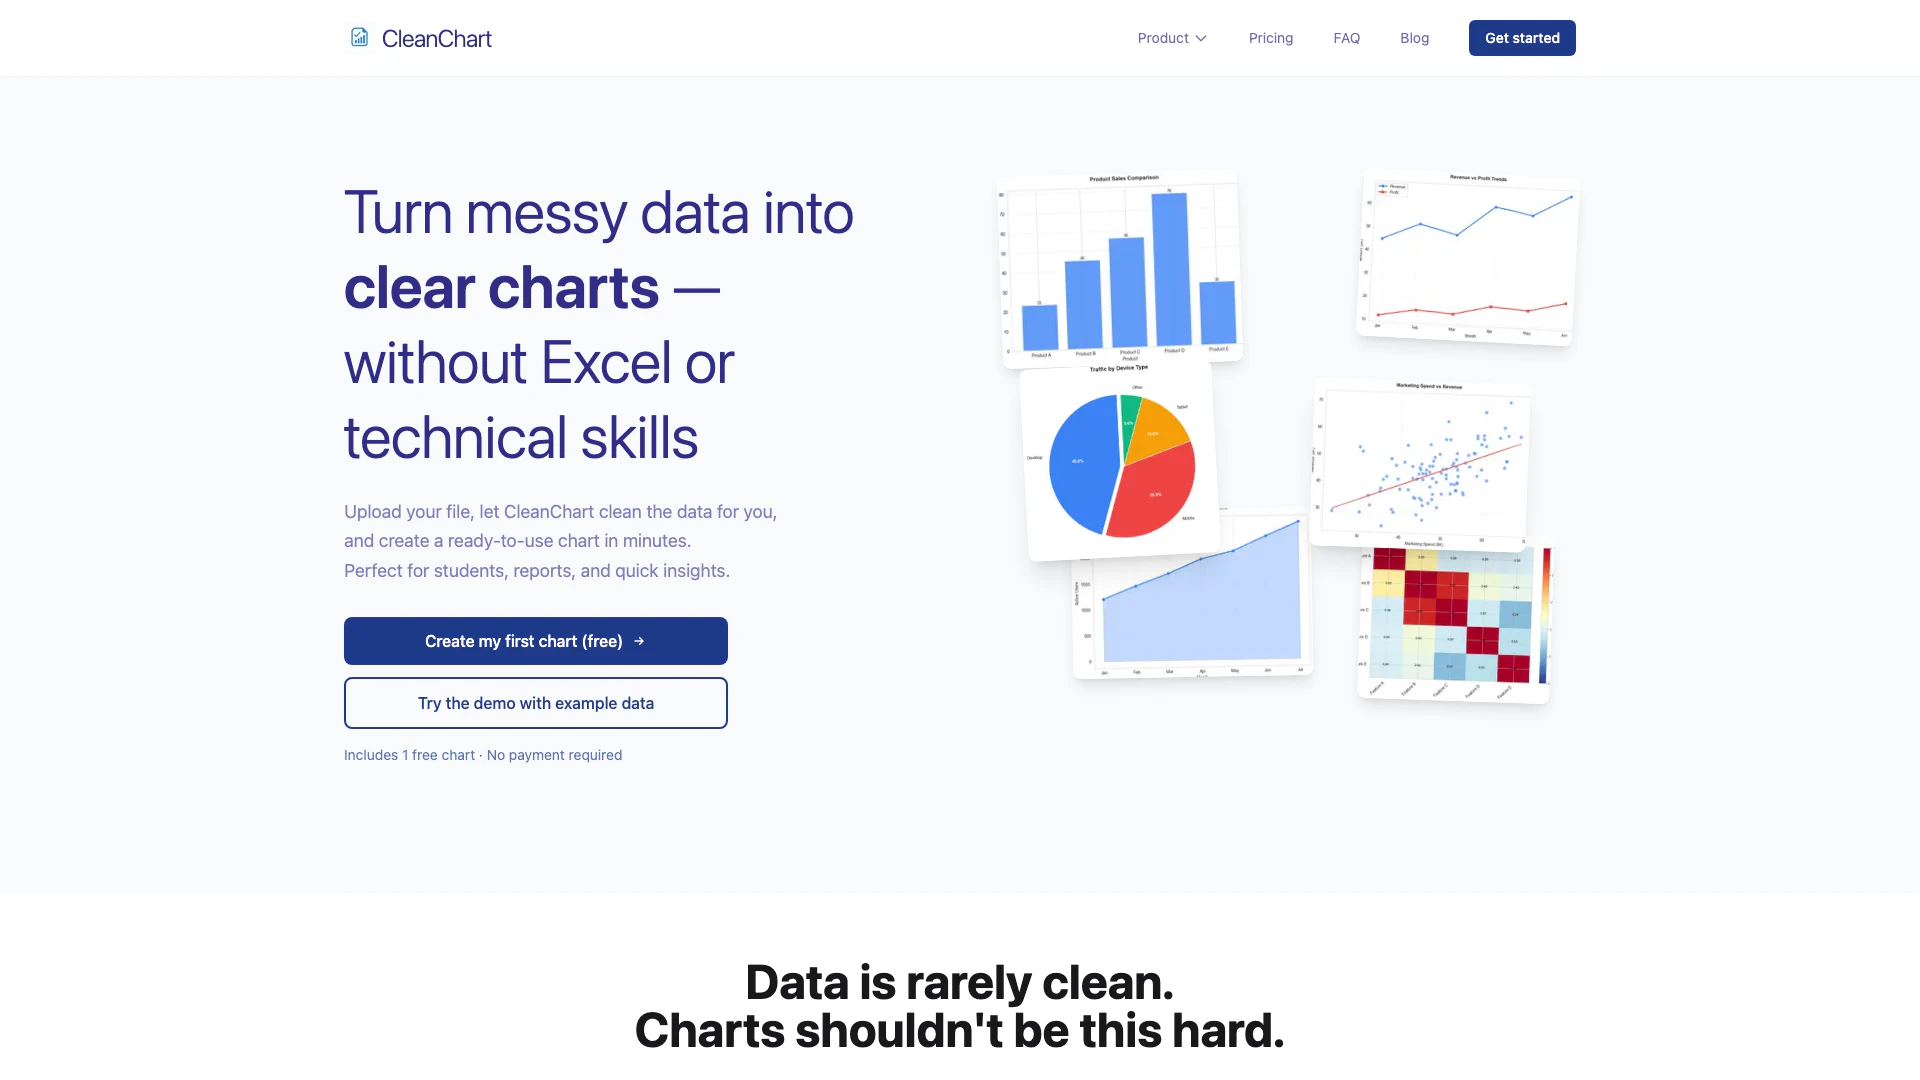
CleanChart is a user-friendly data visualization[1] tool that allows users to upload their messy data files and transform them into clear, professional charts within minutes. Designed specifically for students and non-technical users, CleanChart eliminates the complexities of traditional spreadsheet software like Excel, enabling users to create ready-to-use charts effortlessly. With a focus on simplicity, it offers a free chart with no payment required, making it an ideal solution for quick insights and reports.
How to use CleanChart?
- Visit the CleanChart website and click on 'Create my first chart (free)'.
- Upload your data file (CSV, Excel, JSON, etc.) by dragging and dropping it or clicking to browse.
- CleanChart will automatically process your data, removing errors and formatting it for chart creation[2].
- Choose the type of chart you want (e.g., bar, line, pie) and customize it as needed.
- Download your finished chart or share it directly.
What are the main features of CleanChart?
- Easy data upload from various formats (CSV, Excel, JSON, etc.).
- Automatic data cleaning[3] and error removal.
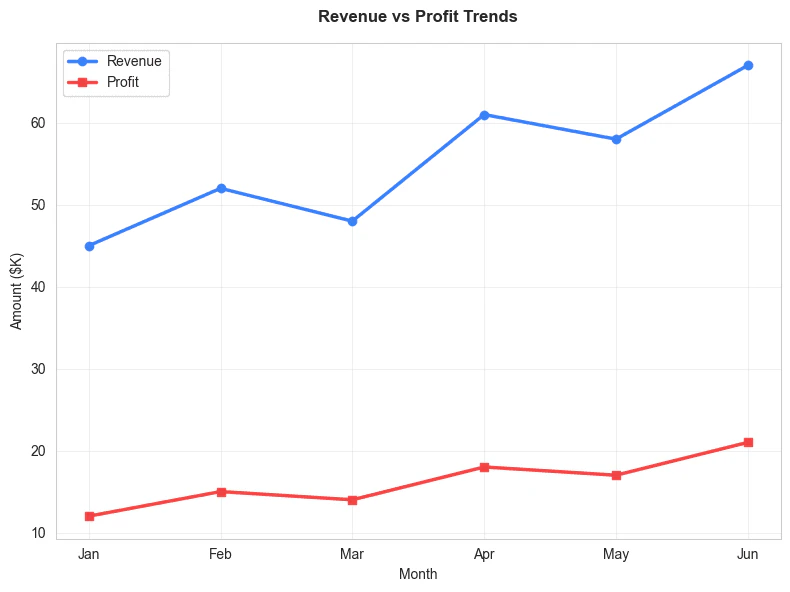
- Quick generation of different chart types[5] (bar, line, pie, scatter, area, heatmap).
- User-friendly interface[4] with no technical skills required.
- One free chart included for new users.
- Demo mode available to explore features without uploading data.
Who is CleanChart for?
CleanChart is tailored for students, educators, and non-technical users who need to create clear and effective charts without the hassle of using complex spreadsheet software. It is particularly beneficial for those working on assignments, reports, or projects who require quick insights and visually appealing charts without any coding or technical expertise.
What are the use cases of CleanChart?
- Creating charts for academic assignments and theses quickly and easily.
- Generating visual reports for business presentations or meetings.
- Producing clear data visualizations for personal projects or research without needing extensive data analysis skills.
Product Images
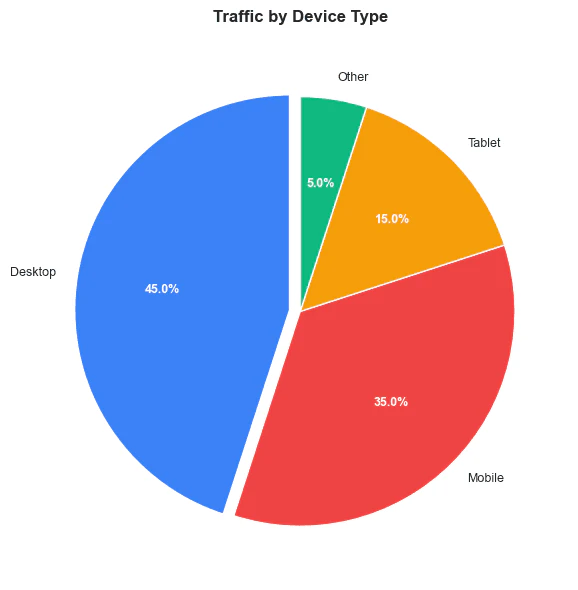
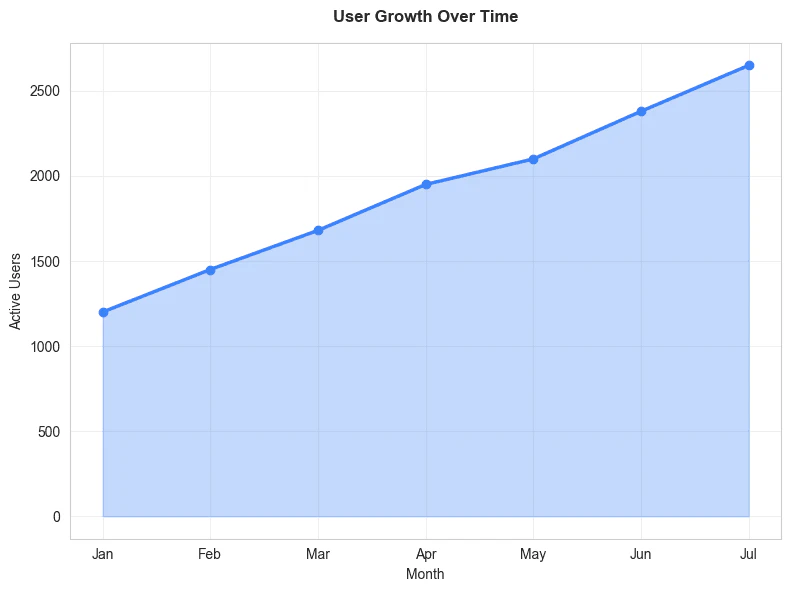
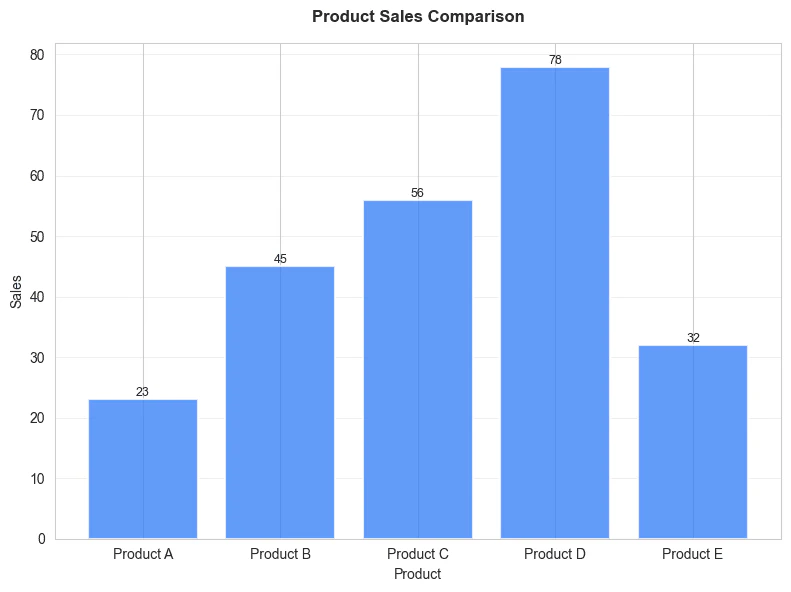
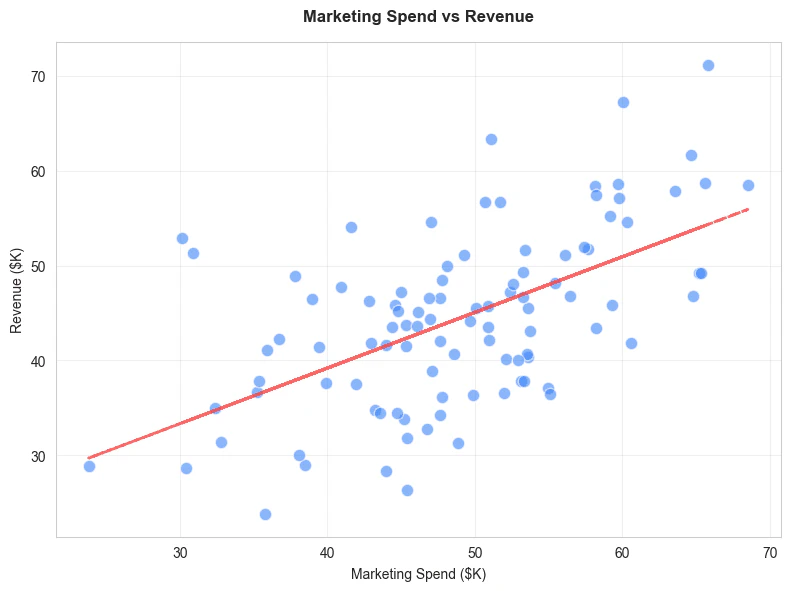
Cleanchart Pros and Cons
Pros
- User-Friendly Interface: CleanChart offers a simple, intuitive interface that allows users to create charts without needing technical skills or knowledge of Excel.
- Quick Data Cleaning: The tool automatically cleans messy data, saving users time and effort in preparing their data for visualization.
- Free Chart Option: Every account includes one free chart, allowing users to test the service without any financial commitment.
Cons
No cons data detected for this tool
Cleanchart Pricing
10 charts
Best for a single assignment or quick report. Enough for one assignment.
30 charts
Most popular. Ideal for reports or thesis work.
50 charts
For larger projects.
Student Monthly
Best for ongoing projects. Unlimited charts with the same features as pay-per-use. Cancel anytime.
For the latest pricing, please visit this link: https://www.cleanchart.app/pricing
Prices are subject to change. Please visit the official website for the most up-to-date pricing information.
Analytics of Cleanchart
Cleanchart Website Traffic Analysis
Visits Over Time
Traffic Sources
Jan 2026 - Jan 2026 Worldwide Desktop Only
- Search: 39.47%
- Direct: 39.41%
- Referrals: 13.67%
- Social: 4.04%
- Paid Referrals: 1.63%
- Mail: 0.25%
Top Keywords
| Keyword | Volume | CPC | Estimated Value |
|---|---|---|---|
| interesting hex codes palletes for graphs | 230 | $0.00 | $0.00 |