Chatviz


What is Chatviz?
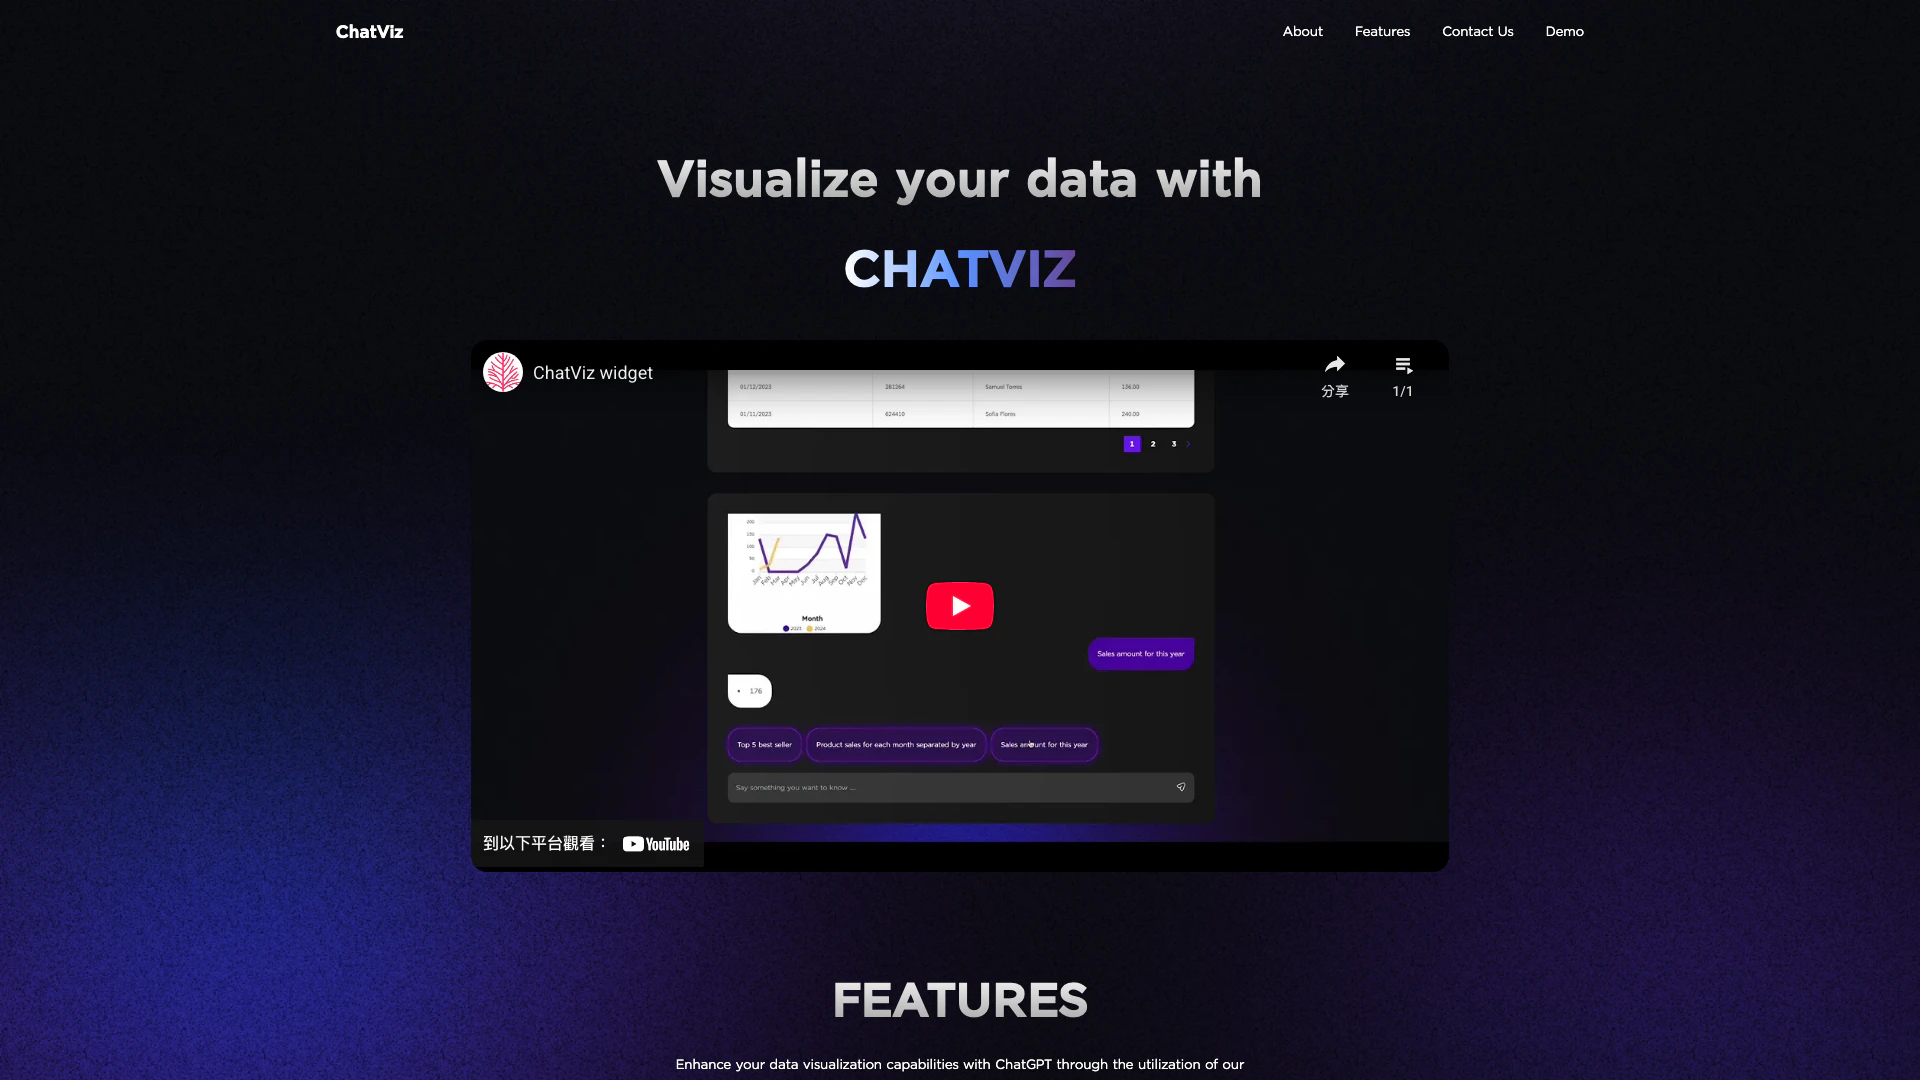
Chatviz is an innovative data visualization[1] tool that leverages the power of ChatGPT[2] to enhance your data representation capabilities. By utilizing its two primary features—SQL translation[3] and chart suggestion[4]—Chatviz simplifies the process of transforming raw data into insightful visual formats. This tool is designed to optimize the user experience in data visualization, making it easier and faster to implement data-driven insights.
How to use Chatviz?
To start using Chatviz, follow these simple steps: 1. Configure your SQL schema to integrate with Chatviz. 2. Set up your webhook to establish a connection with Chatviz. 3. Chatviz will then visualize the output data received from your webhook.
What are the main features of Chatviz?
Chatviz offers several powerful features to enhance data visualization: - SQL Translator: Input prompts to automatically generate SQL query commands, simplifying data retrieval. - Chart Suggestion: Enter your data and receive tailored chart recommendations, making data representation intuitive. - User Experience Optimization: Streamlined processes that significantly reduce development time and complexity in creating dashboards.
Who is Chatviz for?
Chatviz is designed for data analysts, business intelligence professionals, and developers who need to visualize data efficiently. It is particularly beneficial for teams looking to enhance their data visualization capabilities without extensive coding or manual chart creation, making it suitable for both technical and non-technical users.
What are the use cases of Chatviz?
Chatviz can be utilized in various scenarios, including: 1. Business Analytics: Quickly generating visual reports from complex datasets to support decision-making processes. 2. Data-Driven Presentations: Creating visually appealing charts for presentations without needing advanced design skills. 3. Rapid Prototyping: Enabling developers to visualize data outputs during the development phase, facilitating faster iterations and feedback.
Product Images



Chatviz Pros and Cons
Pros
- SQL Query Generation: Chatviz allows users to input prompts to automatically generate SQL queries, streamlining data retrieval.
- Automated Chart Suggestions: The tool automatically creates charts based on input data, enhancing data visualization without manual effort.
- Reduced Development Time: By simplifying the data visualization process, Chatviz optimizes development time, allowing for quicker implementation.
Cons
No cons data detected for this tool
Analytics of Chatviz
Chatviz Website Traffic Analysis
Visits Over Time
Traffic Sources
Dec 2025 - Jan 2026 Worldwide Desktop Only
- Search: 46.58%
- Direct: 32.67%
- Referrals: 12.66%
- Social: 5.67%
- Paid Referrals: 1.16%
- Mail: 0.17%
Top Keywords
| Keyword | Volume | CPC | Estimated Value |
|---|---|---|---|
| chattvi | 50 | $0.00 | $0.00 |